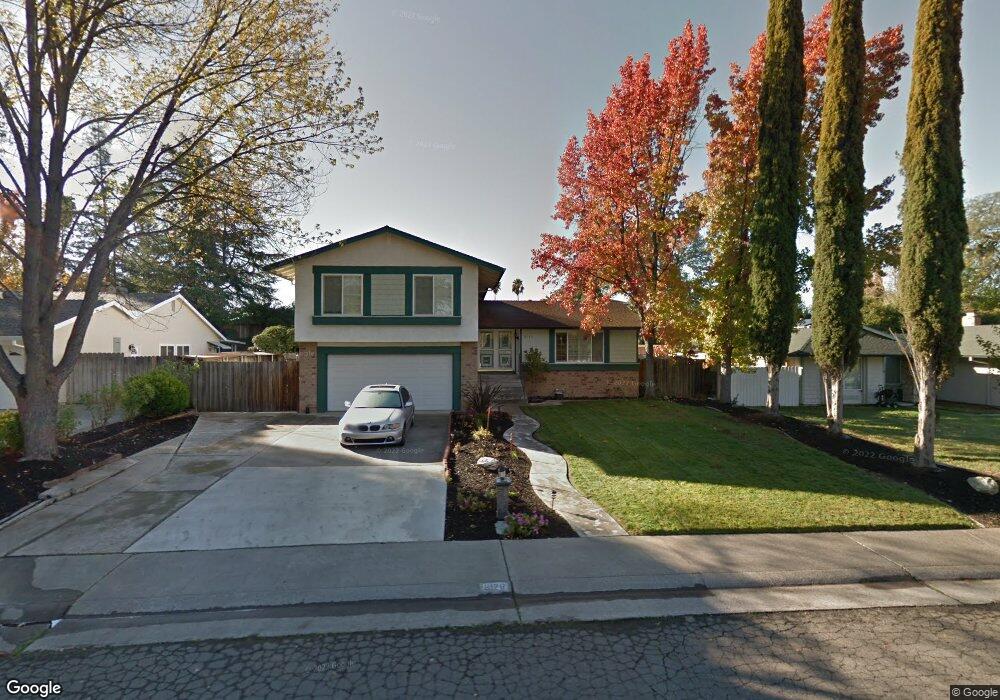
8126 Holm Oak Way Citrus Heights, CA 95610
Estimated Value: $533,000 - $674,753
4
Beds
2
Baths
2,285
Sq Ft
$270/Sq Ft
Est. Value
About This Home
This home is located at 8126 Holm Oak Way, Citrus Heights, CA 95610 and is currently estimated at $616,438, approximately $269 per square foot. 8126 Holm Oak Way is a home located in Sacramento County with nearby schools including Woodside K-8, San Juan High School, and Country Hill Montessori School.
Ownership History
Date
Name
Owned For
Owner Type
Purchase Details
Closed on
Mar 24, 2018
Sold by
Barros Dmytrow Scott and Barros Dmytrow Cathrina
Bought by
Barros Dmytrow Scott Wayne and Barros Dmytrow Cathrina
Current Estimated Value
Purchase Details
Closed on
Oct 7, 2016
Sold by
Dmytrow Scott and Dmytrow Scott
Bought by
Barros Dmytrow Scott and Barros Dmytrow Cathrina
Home Financials for this Owner
Home Financials are based on the most recent Mortgage that was taken out on this home.
Original Mortgage
$351,000
Outstanding Balance
$281,392
Interest Rate
3.46%
Mortgage Type
New Conventional
Estimated Equity
$335,046
Purchase Details
Closed on
Jun 2, 2006
Sold by
Minett Barry A and Minett Suzanne J
Bought by
Dmytrow Scott
Home Financials for this Owner
Home Financials are based on the most recent Mortgage that was taken out on this home.
Original Mortgage
$387,200
Interest Rate
6.56%
Mortgage Type
Fannie Mae Freddie Mac
Create a Home Valuation Report for This Property
The Home Valuation Report is an in-depth analysis detailing your home's value as well as a comparison with similar homes in the area
Home Values in the Area
Average Home Value in this Area
Purchase History
| Date | Buyer | Sale Price | Title Company |
|---|---|---|---|
| Barros Dmytrow Scott Wayne | -- | None Available | |
| Barros Dmytrow Scott | -- | First American Title Company | |
| Dmytrow Scott | $484,000 | Old Republic Title Company |
Source: Public Records
Mortgage History
| Date | Status | Borrower | Loan Amount |
|---|---|---|---|
| Open | Barros Dmytrow Scott | $351,000 | |
| Closed | Dmytrow Scott | $387,200 |
Source: Public Records
Tax History Compared to Growth
Tax History
| Year | Tax Paid | Tax Assessment Tax Assessment Total Assessment is a certain percentage of the fair market value that is determined by local assessors to be the total taxable value of land and additions on the property. | Land | Improvement |
|---|---|---|---|---|
| 2025 | $7,723 | $661,408 | $184,479 | $476,929 |
| 2024 | $7,723 | $648,440 | $180,862 | $467,578 |
| 2023 | $7,525 | $635,726 | $177,316 | $458,410 |
| 2022 | $7,485 | $623,262 | $173,840 | $449,422 |
| 2021 | $6,756 | $561,316 | $115,141 | $446,175 |
| 2020 | $5,741 | $481,817 | $98,834 | $382,983 |
| 2019 | $5,410 | $454,545 | $93,240 | $361,305 |
| 2018 | $5,192 | $432,900 | $88,800 | $344,100 |
| 2017 | $6,382 | $525,829 | $146,666 | $379,163 |
| 2016 | $5,472 | $473,721 | $132,132 | $341,589 |
| 2015 | $5,052 | $438,632 | $122,345 | $316,287 |
| 2014 | $4,802 | $417,745 | $116,519 | $301,226 |
Source: Public Records
Map
Nearby Homes
- 8206 Peregrine Way
- 0 Charlotte Ave
- 1529 Pine Valley Cir
- 1527 Crestmont Ave
- 8232 Garry Oak Dr
- 1814 Vista Creek Dr
- 8058 Mesa Oak Way
- 1501 Crestmont Ave
- 8149 Glen Canyon Ct
- 1309 Hedgerow Ct
- 7812 Auburn Woods Dr
- 8324 Sunrise Blvd
- 1421 Champion Oaks Dr
- 8204 Conover Dr
- 1817 Woodacre Way
- 7836 Wintergreen Dr
- 1812 Wildwood Way
- 1816 Wildwood Way
- 8024 Glen Briar Dr
- 1902 Wildwood Way
- 8122 Holm Oak Way
- 8130 Holm Oak Way
- 8121 English Oak Way
- 8117 English Oak Way
- 8125 English Oak Way
- 8136 Holm Oak Way
- 8125 Holm Oak Way
- 8121 Holm Oak Way
- 8113 English Oak Way
- 8129 Holm Oak Way
- 8144 Holm Oak Way
- 8129 English Oak Way
- 8114 Holm Oak Way
- 8117 Holm Oak Way
- 8133 Holm Oak Way
- 8109 English Oak Way
- 8148 Holm Oak Way
- 8137 Holm Oak Way
- 8113 Holm Oak Way
- 8110 Holm Oak Way