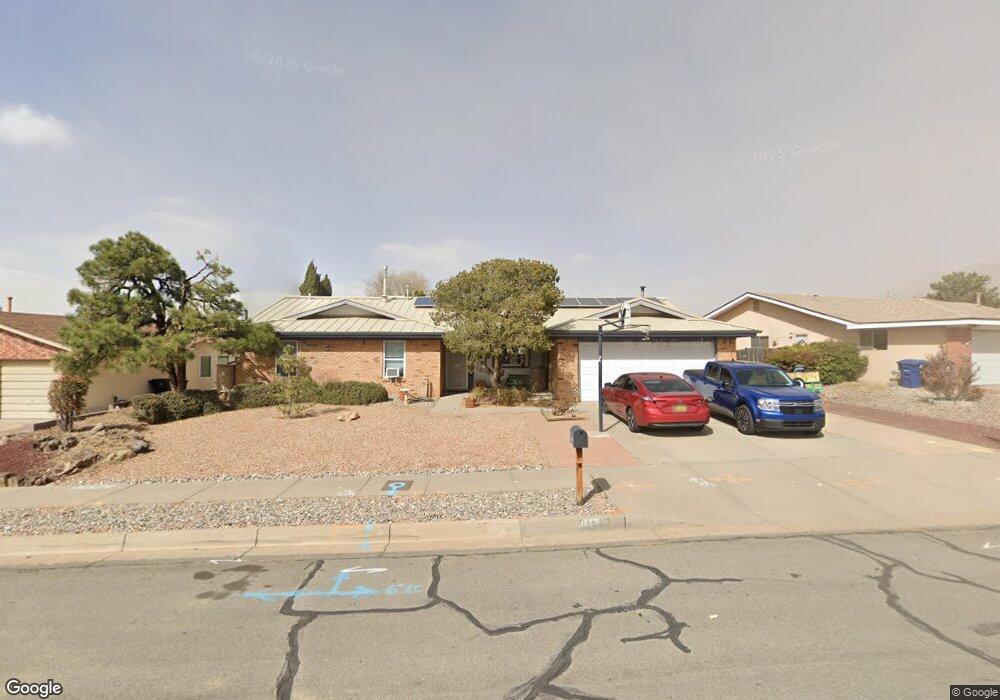
8129 Curry Ave NE Albuquerque, NM 87109
North Wyoming NeighborhoodEstimated Value: $364,000 - $396,000
3
Beds
2
Baths
1,750
Sq Ft
$219/Sq Ft
Est. Value
About This Home
This home is located at 8129 Curry Ave NE, Albuquerque, NM 87109 and is currently estimated at $383,275, approximately $219 per square foot. 8129 Curry Ave NE is a home located in Bernalillo County with nearby schools including Dennis Chavez Elementary School, Madison Middle School, and La Cueva High School.
Ownership History
Date
Name
Owned For
Owner Type
Purchase Details
Closed on
Dec 17, 2021
Sold by
Thompson Ronald E and Thompson Mary E
Bought by
Thompson Living Trust
Current Estimated Value
Purchase Details
Closed on
Aug 24, 2000
Sold by
Slack Cindy L and Slack Alfred P
Bought by
Thompson Ronald E and Thompson Mary E
Home Financials for this Owner
Home Financials are based on the most recent Mortgage that was taken out on this home.
Original Mortgage
$139,816
Interest Rate
8.15%
Mortgage Type
VA
Create a Home Valuation Report for This Property
The Home Valuation Report is an in-depth analysis detailing your home's value as well as a comparison with similar homes in the area
Home Values in the Area
Average Home Value in this Area
Purchase History
| Date | Buyer | Sale Price | Title Company |
|---|---|---|---|
| Thompson Living Trust | -- | Morris Hall Pllc | |
| Thompson Ronald E | -- | None Available | |
| Thompson Ronald E | -- | Fidelity National Title Co |
Source: Public Records
Mortgage History
| Date | Status | Borrower | Loan Amount |
|---|---|---|---|
| Previous Owner | Thompson Ronald E | $139,816 |
Source: Public Records
Tax History Compared to Growth
Tax History
| Year | Tax Paid | Tax Assessment Tax Assessment Total Assessment is a certain percentage of the fair market value that is determined by local assessors to be the total taxable value of land and additions on the property. | Land | Improvement |
|---|---|---|---|---|
| 2025 | $2,915 | $77,331 | $19,922 | $57,409 |
| 2024 | $2,915 | $75,079 | $19,342 | $55,737 |
| 2023 | $2,858 | $72,892 | $18,778 | $54,114 |
| 2022 | $2,755 | $70,770 | $18,232 | $52,538 |
| 2021 | $2,655 | $68,709 | $17,701 | $51,008 |
| 2020 | $2,604 | $66,707 | $17,185 | $49,522 |
| 2019 | $2,520 | $64,765 | $16,685 | $48,080 |
| 2018 | $2,423 | $64,765 | $16,685 | $48,080 |
| 2017 | $2,341 | $62,879 | $16,199 | $46,680 |
| 2016 | $2,266 | $59,270 | $15,269 | $44,001 |
| 2015 | $57,544 | $57,544 | $14,825 | $42,719 |
| 2014 | $2,118 | $55,868 | $14,393 | $41,475 |
| 2013 | -- | $54,241 | $13,974 | $40,267 |
Source: Public Records
Map
Nearby Homes
- 8000 Loma Del Norte Rd NE
- 8217 Colfax Ave NE
- 8228 Ruidoso Rd NE
- 0 Jemez Place Unit 1084210
- 8233 Otero Ave NE
- 7516 Jemez St NE
- 8325 Ruidoso Rd NE
- 7613 Jemez St NE
- 7339 Natalie Janae Ln NE
- 7232 Gallinas Ave NE
- 7401 Scotts Place NE
- 8320 Cherry Hills Dr NE
- 8214 Krim Dr NE
- 7317 Vivian Dr NE
- 7225 Ticonderoga Rd NE
- 7109 Derickson Ave NE
- 6808 Frantz Dr NE
- 7235 Whippoorwill Ln NE
- 8900 San Francisco Rd NE
- 7232 Bobwhite Ln NE
- 8125 Curry Ave NE
- 8133 Curry Ave NE
- 8124 Loma Del Norte Rd NE
- 8124 Loma Del Norte Rd NE Unit DR
- 8120 Loma Del Norte Rd NE
- 8121 Curry Ave NE
- 8128 Curry Ave NE
- 8128 Loma Del Norte Rd NE
- 8124 Curry Ave NE
- 8117 Curry Ave NE
- 8120 Curry Ave NE
- 8116 Loma Del Norte Rd NE
- 7404 Malaga Dr NE
- 7400 Malaga Dr NE
- 7316 Malaga Dr NE
- 7309 Malaga Dr NE
- 7312 Malaga Dr NE
- 7408 Malaga Dr NE
- 8113 Curry Ave NE
- 8116 Curry Ave NE