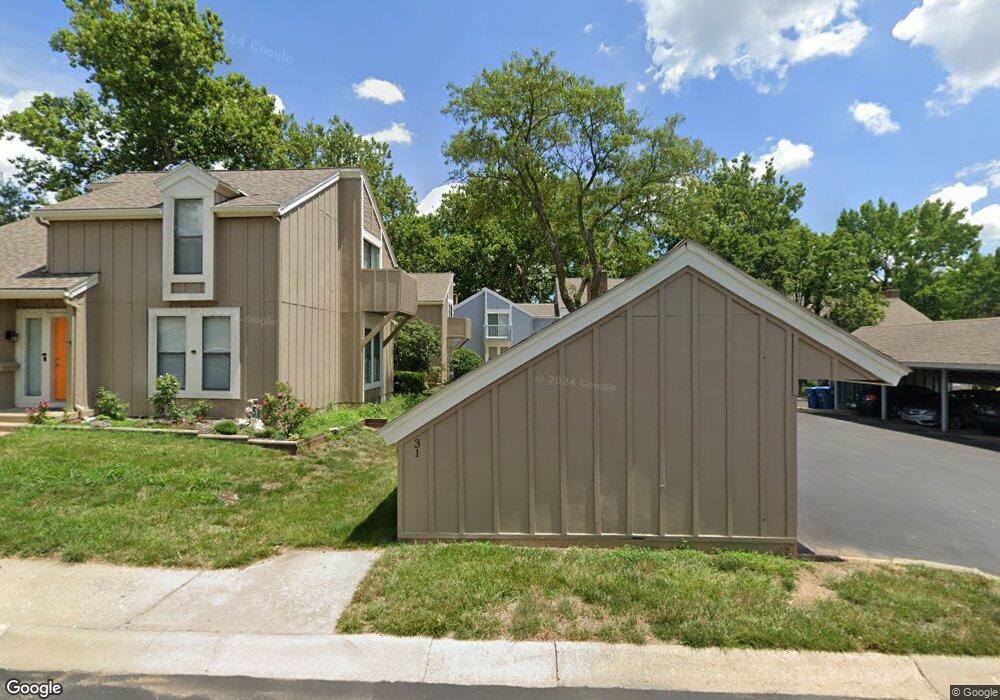
8129 Monrovia St Lenexa, KS 66215
Estimated Value: $245,910 - $271,000
3
Beds
3
Baths
1,554
Sq Ft
$166/Sq Ft
Est. Value
About This Home
This home is located at 8129 Monrovia St, Lenexa, KS 66215 and is currently estimated at $257,978, approximately $166 per square foot. 8129 Monrovia St is a home located in Johnson County with nearby schools including Rising Star Elementary School, Trailridge Middle School, and Shawnee Mission Northwest High School.
Ownership History
Date
Name
Owned For
Owner Type
Purchase Details
Closed on
Jul 31, 2009
Sold by
Dennis Christine E
Bought by
Dennis Christine E
Current Estimated Value
Create a Home Valuation Report for This Property
The Home Valuation Report is an in-depth analysis detailing your home's value as well as a comparison with similar homes in the area
Home Values in the Area
Average Home Value in this Area
Purchase History
| Date | Buyer | Sale Price | Title Company |
|---|---|---|---|
| Dennis Christine E | -- | None Available |
Source: Public Records
Tax History
| Year | Tax Paid | Tax Assessment Tax Assessment Total Assessment is a certain percentage of the fair market value that is determined by local assessors to be the total taxable value of land and additions on the property. | Land | Improvement |
|---|---|---|---|---|
| 2025 | $2,650 | $23,817 | $3,795 | $20,022 |
| 2024 | $2,650 | $24,219 | $3,795 | $20,424 |
| 2023 | $2,577 | $22,839 | $3,450 | $19,389 |
| 2022 | $2,215 | $19,585 | $3,002 | $16,583 |
| 2021 | $2,137 | $17,734 | $2,726 | $15,008 |
| 2020 | $2,149 | $17,664 | $2,474 | $15,190 |
| 2019 | $2,015 | $16,526 | $2,474 | $14,052 |
| 2018 | $2,009 | $16,341 | $2,248 | $14,093 |
| 2017 | $1,860 | $14,628 | $1,955 | $12,673 |
| 2016 | $1,886 | $14,663 | $1,955 | $12,708 |
| 2015 | $1,703 | $13,283 | $1,955 | $11,328 |
| 2013 | -- | $11,443 | $1,955 | $9,488 |
Source: Public Records
Map
Nearby Homes
- 12100 W 82nd Terrace
- 8058 Colony Ln
- 8287 Monrovia St
- 12201 W 79th Terrace
- 12212 W 79th Terrace
- 7808 Long Ave
- 12521 W 85th Terrace
- 8545 Westgate St
- 12525 W 85th Terrace
- 8422 Rosehill Rd
- 12908 W 84th St
- 8221 Noland Rd
- 13212 W 84th St
- 8211 Caenen Lake Rd
- 13204 W 85th Ct
- 13403 W 78th Place
- 13408 W 78th Terrace
- 13511 W 82nd St
- 8537 Goddard St
- 10804 W 76th St
- 8131 Monrovia St
- 8133 Monrovia St
- 8135 Monrovia St
- 8125 Monrovia St
- 8137 Monrovia St
- 8123 Monrovia St
- 8139 Monrovia St
- 8127 Monrovia St
- 8121 Monrovia St
- 8138 Halsey St
- 8136 Halsey St
- 8156 Halsey St
- 8154 Halsey St
- 8152 Halsey St
- 8160 Halsey St
- 8150 Halsey St
- 8132 Halsey St
- 8172 Halsey St
- 8148 Halsey St
- 8170 Halsey St
Your Personal Tour Guide
Ask me questions while you tour the home.