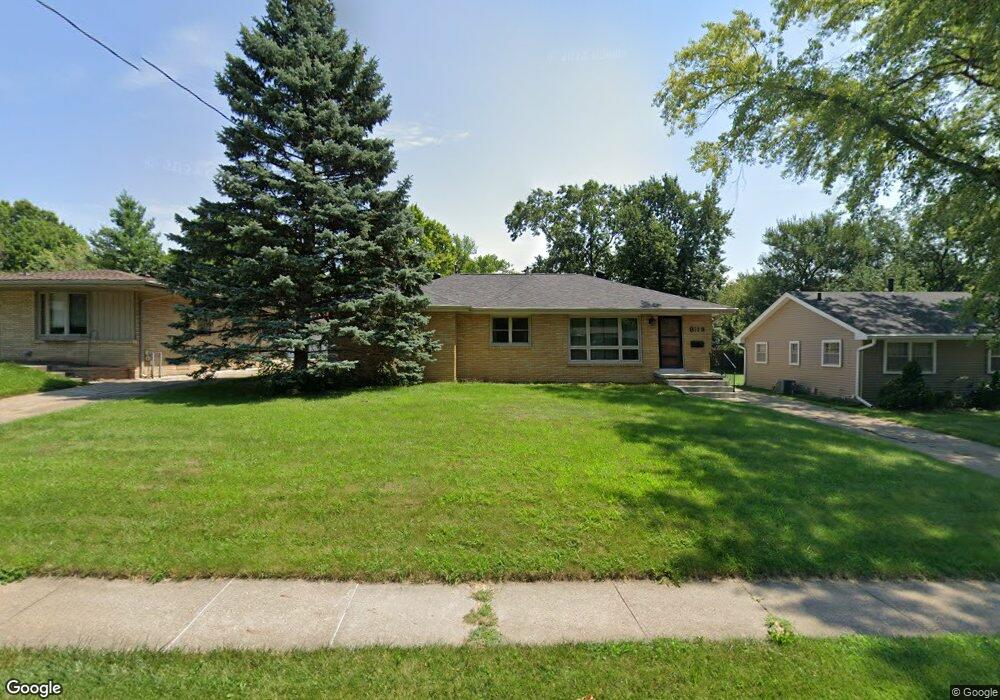
813 28th St West Des Moines, IA 50265
Estimated Value: $297,769 - $326,000
4
Beds
2
Baths
1,404
Sq Ft
$224/Sq Ft
Est. Value
About This Home
This home is located at 813 28th St, West Des Moines, IA 50265 and is currently estimated at $314,192, approximately $223 per square foot. 813 28th St is a home located in Polk County with nearby schools including Fairmeadows Elementary School, Stilwell Junior High School, and Valley Southwoods Freshman High School.
Ownership History
Date
Name
Owned For
Owner Type
Purchase Details
Closed on
Feb 3, 2012
Sold by
Butz Keith A and Butz Charlene N
Bought by
Jones Craig
Current Estimated Value
Home Financials for this Owner
Home Financials are based on the most recent Mortgage that was taken out on this home.
Original Mortgage
$137,500
Outstanding Balance
$15,080
Interest Rate
3.22%
Mortgage Type
New Conventional
Estimated Equity
$299,112
Purchase Details
Closed on
Mar 12, 2008
Sold by
Eisinger Catherine F
Bought by
Butz Keith A and Butz Charlene N
Home Financials for this Owner
Home Financials are based on the most recent Mortgage that was taken out on this home.
Original Mortgage
$123,000
Interest Rate
5.75%
Mortgage Type
Purchase Money Mortgage
Purchase Details
Closed on
May 4, 2006
Sold by
Stephens Everett L and Stephens Louise P
Bought by
Thomsen Eleanor
Home Financials for this Owner
Home Financials are based on the most recent Mortgage that was taken out on this home.
Original Mortgage
$123,920
Interest Rate
6.39%
Mortgage Type
Fannie Mae Freddie Mac
Create a Home Valuation Report for This Property
The Home Valuation Report is an in-depth analysis detailing your home's value as well as a comparison with similar homes in the area
Home Values in the Area
Average Home Value in this Area
Purchase History
| Date | Buyer | Sale Price | Title Company |
|---|---|---|---|
| Jones Craig | $157,000 | Itc | |
| Butz Keith A | $163,500 | Itc | |
| Thomsen Eleanor | $154,500 | Itc |
Source: Public Records
Mortgage History
| Date | Status | Borrower | Loan Amount |
|---|---|---|---|
| Open | Jones Craig | $137,500 | |
| Previous Owner | Butz Keith A | $123,000 | |
| Previous Owner | Thomsen Eleanor | $123,920 |
Source: Public Records
Tax History Compared to Growth
Tax History
| Year | Tax Paid | Tax Assessment Tax Assessment Total Assessment is a certain percentage of the fair market value that is determined by local assessors to be the total taxable value of land and additions on the property. | Land | Improvement |
|---|---|---|---|---|
| 2025 | $3,686 | $285,000 | $75,700 | $209,300 |
| 2024 | $3,686 | $251,700 | $65,900 | $185,800 |
| 2023 | $3,732 | $251,700 | $65,900 | $185,800 |
| 2022 | $3,686 | $205,500 | $55,800 | $149,700 |
| 2021 | $3,656 | $205,500 | $55,800 | $149,700 |
| 2020 | $3,596 | $194,200 | $52,700 | $141,500 |
| 2019 | $3,324 | $194,200 | $52,700 | $141,500 |
| 2018 | $3,326 | $174,000 | $46,200 | $127,800 |
| 2017 | $3,098 | $174,000 | $46,200 | $127,800 |
| 2016 | $3,024 | $158,300 | $41,500 | $116,800 |
| 2015 | $3,024 | $158,300 | $41,500 | $116,800 |
| 2014 | $2,694 | $145,200 | $37,300 | $107,900 |
Source: Public Records
Map
Nearby Homes