813 Brummel St Evanston, IL 60202
Howard Street NeighborhoodEstimated Value: $352,935 - $408,000
3
Beds
2
Baths
1,350
Sq Ft
$289/Sq Ft
Est. Value
About This Home
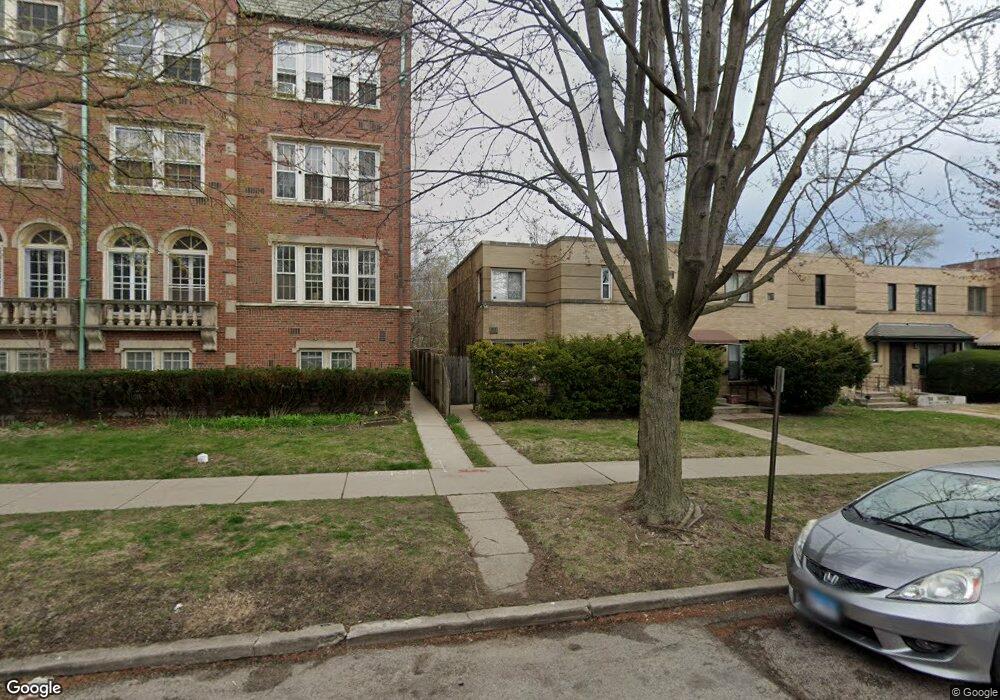
This home is located at 813 Brummel St, Evanston, IL 60202 and is currently estimated at $389,734, approximately $288 per square foot. 813 Brummel St is a home located in Cook County with nearby schools including Oakton Elementary School, Chute Middle School, and Evanston Township High School.
Ownership History
Date
Name
Owned For
Owner Type
Purchase Details
Closed on
May 16, 2008
Sold by
Strudeman Laura A and Lebaron Michael
Bought by
Horek Jon D and Gualtier Jayme E
Current Estimated Value
Home Financials for this Owner
Home Financials are based on the most recent Mortgage that was taken out on this home.
Original Mortgage
$206,000
Outstanding Balance
$129,053
Interest Rate
5.93%
Mortgage Type
Unknown
Estimated Equity
$260,681
Purchase Details
Closed on
Aug 24, 2000
Sold by
Peterson Jennifer A
Bought by
Strudeman Laura A
Home Financials for this Owner
Home Financials are based on the most recent Mortgage that was taken out on this home.
Original Mortgage
$123,200
Interest Rate
7.9%
Purchase Details
Closed on
Jul 26, 1996
Sold by
Schmidt Jon C
Bought by
Peterson Jennifer A
Home Financials for this Owner
Home Financials are based on the most recent Mortgage that was taken out on this home.
Original Mortgage
$109,250
Interest Rate
8.43%
Create a Home Valuation Report for This Property
The Home Valuation Report is an in-depth analysis detailing your home's value as well as a comparison with similar homes in the area
Home Values in the Area
Average Home Value in this Area
Purchase History
| Date | Buyer | Sale Price | Title Company |
|---|---|---|---|
| Horek Jon D | $265,000 | None Available | |
| Strudeman Laura A | $165,000 | -- | |
| Peterson Jennifer A | $115,000 | First American Title |
Source: Public Records
Mortgage History
| Date | Status | Borrower | Loan Amount |
|---|---|---|---|
| Open | Horek Jon D | $206,000 | |
| Previous Owner | Strudeman Laura A | $123,200 | |
| Previous Owner | Peterson Jennifer A | $109,250 |
Source: Public Records
Tax History
| Year | Tax Paid | Tax Assessment Tax Assessment Total Assessment is a certain percentage of the fair market value that is determined by local assessors to be the total taxable value of land and additions on the property. | Land | Improvement |
|---|---|---|---|---|
| 2025 | $6,053 | $29,000 | $6,234 | $22,766 |
| 2024 | $6,053 | $27,992 | $4,502 | $23,490 |
| 2023 | $5,781 | $27,992 | $4,502 | $23,490 |
| 2022 | $5,781 | $27,992 | $4,502 | $23,490 |
| 2021 | $5,147 | $22,469 | $2,788 | $19,681 |
| 2020 | $5,138 | $22,469 | $2,788 | $19,681 |
| 2019 | $5,138 | $25,077 | $2,788 | $22,289 |
| 2018 | $5,015 | $21,500 | $2,296 | $19,204 |
| 2017 | $4,899 | $21,500 | $2,296 | $19,204 |
| 2016 | $4,871 | $21,500 | $2,296 | $19,204 |
| 2015 | $5,099 | $21,373 | $3,445 | $17,928 |
| 2014 | $5,386 | $22,567 | $3,445 | $19,122 |
| 2013 | $5,246 | $22,567 | $3,445 | $19,122 |
Source: Public Records
Map
Nearby Homes
- 803 Brummel St
- 131 Elmwood Ave Unit 2N
- 817 Brummel St Unit 2N
- 135 Ridge Ave Unit 1W
- 820 Dobson St Unit 3E
- 7540 N Ridge Blvd Unit 6C
- 2032 W Birchwood Ave
- 149 Callan Ave Unit 3E
- 323 Sherman Ave
- 2018 W Birchwood Ave
- 121 Callan Ave Unit 3S
- 7511 N Damen Ave Unit D2
- 132 Clyde Ave Unit 3
- 7453 N Hoyne Ave Unit 3S
- 1949 W Birchwood Ave Unit 2
- 407 Custer Ave Unit 3S
- 409 Custer Ave Unit 3N
- 7420 N Winchester Ave Unit 2A
- 7411 N Hoyne Ave Unit 3
- 711 Austin St Unit 303
- 811 Brummel St
- 809 Brummel St
- 815 Brummel St Unit G
- 815 Brummel St Unit 2
- 815 Brummel St Unit 8151
- 817 Brummel St Unit 8171S
- 815 Brummel St Unit 815G
- 817 Brummel St Unit 8172S
- 817 Brummel St Unit 8173N
- 817 Brummel St Unit 8172N
- 817 Brummel St Unit 8171N
- 815 Brummel St Unit 8153
- 817 Brummel St Unit 8173S
- 815 Brummel St Unit 8152
- 817 Brummel St Unit 3N
- 817 Brummel St Unit 2S
- 815 Brummel St Unit 3
- 815 Brummel St Unit 1
- 817 Brummel St Unit 3S
- 807 Brummel St
Your Personal Tour Guide
Ask me questions while you tour the home.