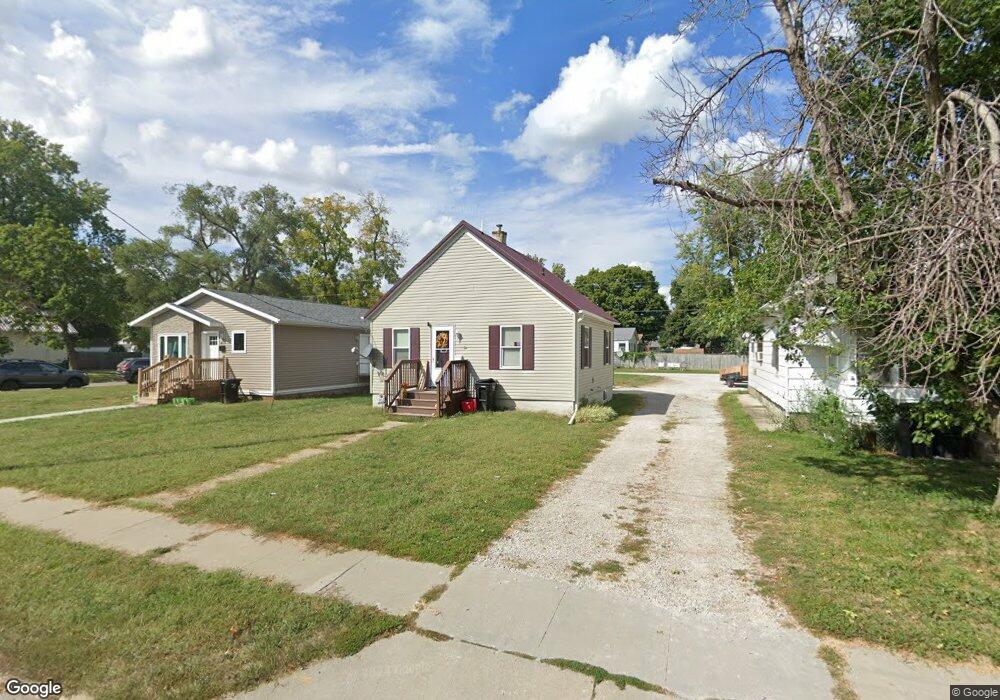
813 Chester Ave Ottumwa, IA 52501
Estimated Value: $59,000 - $67,000
1
Bed
1
Bath
576
Sq Ft
$108/Sq Ft
Est. Value
About This Home
This home is located at 813 Chester Ave, Ottumwa, IA 52501 and is currently estimated at $62,231, approximately $108 per square foot. 813 Chester Ave is a home located in Wapello County with nearby schools including Liberty Elementary School, Douma Elementary School, and Evans Middle School.
Ownership History
Date
Name
Owned For
Owner Type
Purchase Details
Closed on
Dec 16, 2024
Sold by
Rushman James and Rushman Lori
Bought by
Ottumwa Rentals Llc
Current Estimated Value
Home Financials for this Owner
Home Financials are based on the most recent Mortgage that was taken out on this home.
Original Mortgage
$51,000
Outstanding Balance
$50,599
Interest Rate
6.79%
Mortgage Type
Credit Line Revolving
Estimated Equity
$11,632
Purchase Details
Closed on
Mar 19, 2020
Sold by
Shoemaker Stephanie
Bought by
Rushman James and Rushman Lori
Purchase Details
Closed on
Feb 27, 2009
Sold by
Garr David P and Garr Julie A
Bought by
Shoemaker Stephanie
Purchase Details
Closed on
Nov 2, 2007
Sold by
Earth Sisters Inc
Bought by
Garr David P and Garr Julia A
Purchase Details
Closed on
Aug 3, 2005
Sold by
Morrissey Charles H and Morrissey Paula A
Bought by
Earth Sisters Inc
Create a Home Valuation Report for This Property
The Home Valuation Report is an in-depth analysis detailing your home's value as well as a comparison with similar homes in the area
Home Values in the Area
Average Home Value in this Area
Purchase History
| Date | Buyer | Sale Price | Title Company |
|---|---|---|---|
| Ottumwa Rentals Llc | $65,000 | None Listed On Document | |
| Ottumwa Rentals Llc | $65,000 | None Listed On Document | |
| Rushman James | $35,000 | None Available | |
| Shoemaker Stephanie | $38,500 | None Available | |
| Garr David P | $27,000 | None Available | |
| Earth Sisters Inc | $18,000 | None Available |
Source: Public Records
Mortgage History
| Date | Status | Borrower | Loan Amount |
|---|---|---|---|
| Open | Ottumwa Rentals Llc | $51,000 | |
| Closed | Ottumwa Rentals Llc | $51,000 |
Source: Public Records
Tax History Compared to Growth
Tax History
| Year | Tax Paid | Tax Assessment Tax Assessment Total Assessment is a certain percentage of the fair market value that is determined by local assessors to be the total taxable value of land and additions on the property. | Land | Improvement |
|---|---|---|---|---|
| 2025 | $992 | $49,490 | $7,480 | $42,010 |
| 2024 | $992 | $45,760 | $7,480 | $38,280 |
| 2023 | $880 | $45,760 | $7,480 | $38,280 |
| 2022 | $904 | $36,840 | $7,480 | $29,360 |
| 2021 | $904 | $35,600 | $7,480 | $28,120 |
| 2020 | $588 | $31,640 | $7,480 | $24,160 |
| 2019 | $606 | $31,640 | $0 | $0 |
| 2018 | $584 | $31,640 | $0 | $0 |
| 2017 | $670 | $34,320 | $0 | $0 |
| 2016 | $788 | $40,269 | $0 | $0 |
| 2015 | $790 | $40,269 | $0 | $0 |
| 2014 | $790 | $40,269 | $0 | $0 |
Source: Public Records
Map
Nearby Homes
- 1005 Hamilton St
- 138 Minnesota St
- 433 W Finley Ave
- 117 Lynwood Ave
- 1401 W Finley Ave
- 319 Hamilton St
- 420 S Ferry St
- 1508 Hamilton St
- 1502 W Finley Ave
- 9 Kingsley Dr
- 448 Mckinley Ave
- 1522 Greenwood Dr
- 120 Shaul Ave
- 513 Lynwood Cir
- 1322 Mowrey Ave
- 530 Leighton St
- 1018 W Mary St
- 317 S Ward St
- 404 W Mary St
- 1507 Mowrey Ave
- 817 Chester Ave
- 805 Chester Ave
- 316 N Pocahontas St
- 803 Chester Ave
- 318 N Pocahontas St
- 901 Chester Ave
- 311 N Ferry St
- 309 N Ferry St
- 324 N Pocahontas St
- 315 N Ferry St
- 315 N Pocahontas St
- 321 N Ferry St
- 911 Chester Ave
- 317 N Pocahontas St
- 321 N Pocahontas St
- 325 N Ferry St
- 326 N Pocahontas St
- 915 Chester Ave
- 719 Chester Ave
- 308 N Ferry St