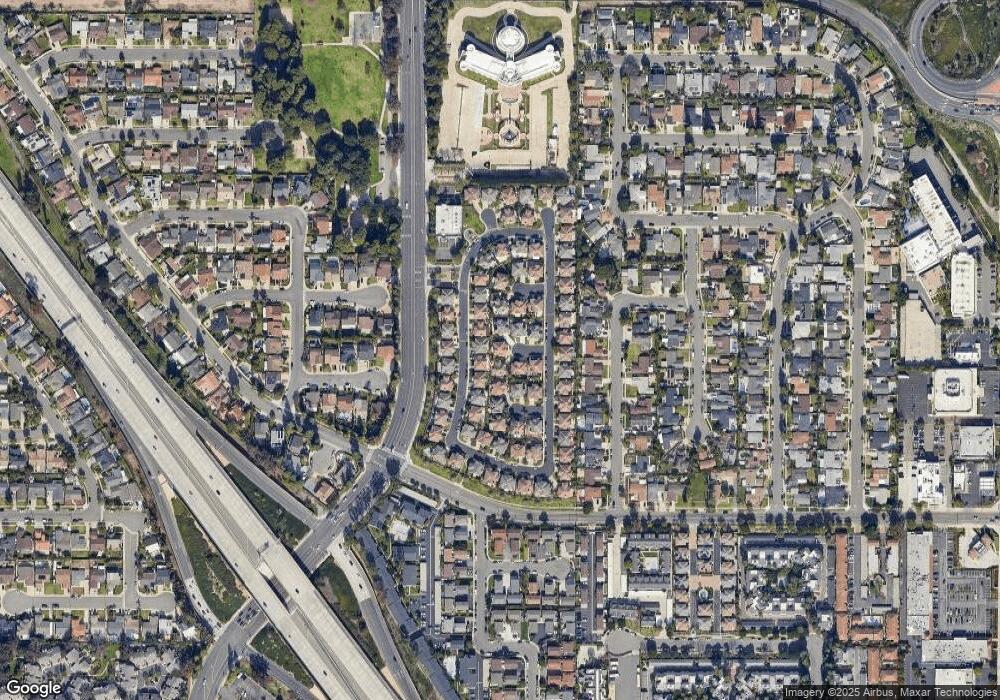
813 Gallery Ct Costa Mesa, CA 92626
Northside Costa Mesa NeighborhoodEstimated Value: $1,389,000 - $1,618,000
4
Beds
3
Baths
2,160
Sq Ft
$678/Sq Ft
Est. Value
About This Home
This home is located at 813 Gallery Ct, Costa Mesa, CA 92626 and is currently estimated at $1,465,376, approximately $678 per square foot. 813 Gallery Ct is a home located in Orange County with nearby schools including Paularino Elementary School, Costa Mesa High School, and California Pacific Charter - San Diego.
Ownership History
Date
Name
Owned For
Owner Type
Purchase Details
Closed on
Jul 13, 2009
Sold by
Kruly Greg S and Kruly Patricia A
Bought by
Kruly Greg S and Kruly Patricia A
Current Estimated Value
Purchase Details
Closed on
Sep 23, 1996
Sold by
Polygon South Coast Associates Lp
Bought by
Kruly Greg S and Kruly Patricia A
Home Financials for this Owner
Home Financials are based on the most recent Mortgage that was taken out on this home.
Original Mortgage
$70,400
Interest Rate
7.74%
Create a Home Valuation Report for This Property
The Home Valuation Report is an in-depth analysis detailing your home's value as well as a comparison with similar homes in the area
Home Values in the Area
Average Home Value in this Area
Purchase History
| Date | Buyer | Sale Price | Title Company |
|---|---|---|---|
| Kruly Greg S | -- | None Available | |
| Kruly Greg S | $291,000 | First American Title Ins Co |
Source: Public Records
Mortgage History
| Date | Status | Borrower | Loan Amount |
|---|---|---|---|
| Previous Owner | Kruly Greg S | $70,400 |
Source: Public Records
Tax History
| Year | Tax Paid | Tax Assessment Tax Assessment Total Assessment is a certain percentage of the fair market value that is determined by local assessors to be the total taxable value of land and additions on the property. | Land | Improvement |
|---|---|---|---|---|
| 2025 | $5,861 | $477,274 | $127,246 | $350,028 |
| 2024 | $5,861 | $467,916 | $124,751 | $343,165 |
| 2023 | $5,653 | $458,742 | $122,305 | $336,437 |
| 2022 | $5,448 | $449,748 | $119,907 | $329,841 |
| 2021 | $5,278 | $440,930 | $117,556 | $323,374 |
| 2020 | $5,213 | $436,409 | $116,350 | $320,059 |
| 2019 | $5,100 | $427,852 | $114,068 | $313,784 |
| 2018 | $4,997 | $419,463 | $111,831 | $307,632 |
| 2017 | $4,914 | $411,239 | $109,639 | $301,600 |
| 2016 | $4,810 | $403,176 | $107,489 | $295,687 |
| 2015 | $4,763 | $397,120 | $105,874 | $291,246 |
| 2014 | $4,656 | $389,341 | $103,800 | $285,541 |
Source: Public Records
Map
Nearby Homes
- 3143 Canadian Dr
- 810 Baker St Unit 112
- 783 Grayling
- 952 Cheyenne St
- 917 Helena Cir
- 944 Tesla Ln
- 3032 Grant Ave
- 970 Valencia St
- 3012 Garfield Ave
- 559 Traverse Dr
- 895 Sonora Rd
- 1068 Concord St
- 1016 Valencia St
- 3084 Taylor Way
- 1030 Palmetto Way
- 511 Sturgeon Dr
- 2702 San Lucas Ln
- 832 Presidio Dr
- 3263 Turlock Dr
- 913 Junipero Dr
Your Personal Tour Guide
Ask me questions while you tour the home.
