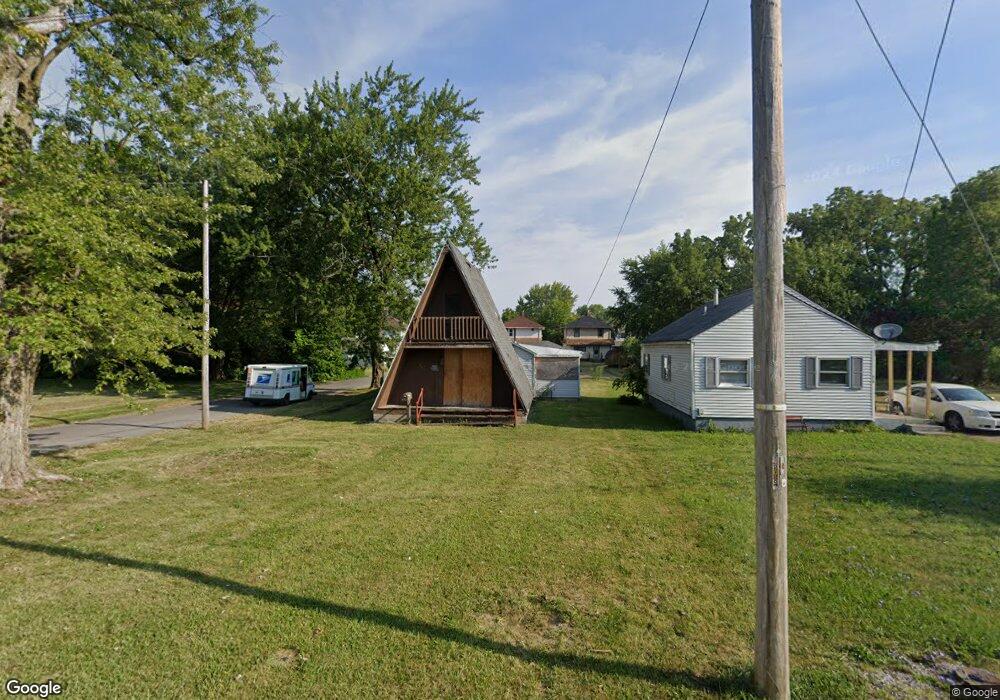
813 Hope St Lima, OH 45804
Southside Lima NeighborhoodEstimated Value: $50,721 - $57,000
2
Beds
1
Bath
1,160
Sq Ft
$47/Sq Ft
Est. Value
About This Home
This home is located at 813 Hope St, Lima, OH 45804 and is currently estimated at $54,930, approximately $47 per square foot. 813 Hope St is a home located in Allen County with nearby schools including Unity Elementary School, Lima North Middle School, and Lima West Middle School.
Ownership History
Date
Name
Owned For
Owner Type
Purchase Details
Closed on
Oct 21, 2023
Sold by
Calhoun Dionandre C
Bought by
Manley Terrance V
Current Estimated Value
Purchase Details
Closed on
Aug 25, 2020
Sold by
Superior Credit Union
Bought by
Calhoun Dionandre C
Purchase Details
Closed on
Aug 13, 2019
Sold by
Stemen Rebecca S and Stemen Robert W
Bought by
Superior Credit Union
Purchase Details
Closed on
Jun 27, 2005
Sold by
Michael Blaine E and Michael Kimberly A
Bought by
Stemen Robert W and Stemen Rebecca
Home Financials for this Owner
Home Financials are based on the most recent Mortgage that was taken out on this home.
Original Mortgage
$3,000
Interest Rate
5.75%
Mortgage Type
Purchase Money Mortgage
Purchase Details
Closed on
Nov 14, 1984
Bought by
Michael Derry J
Create a Home Valuation Report for This Property
The Home Valuation Report is an in-depth analysis detailing your home's value as well as a comparison with similar homes in the area
Home Values in the Area
Average Home Value in this Area
Purchase History
| Date | Buyer | Sale Price | Title Company |
|---|---|---|---|
| Manley Terrance V | $9,000 | None Listed On Document | |
| Calhoun Dionandre C | $3,000 | None Available | |
| Superior Credit Union | $5,000 | None Available | |
| Stemen Robert W | $19,000 | None Available | |
| Michael Derry J | $4,500 | -- |
Source: Public Records
Mortgage History
| Date | Status | Borrower | Loan Amount |
|---|---|---|---|
| Previous Owner | Stemen Robert W | $3,000 |
Source: Public Records
Tax History
| Year | Tax Paid | Tax Assessment Tax Assessment Total Assessment is a certain percentage of the fair market value that is determined by local assessors to be the total taxable value of land and additions on the property. | Land | Improvement |
|---|---|---|---|---|
| 2024 | $365 | $8,160 | $1,120 | $7,040 |
| 2023 | $444 | $7,740 | $1,050 | $6,690 |
| 2022 | $395 | $7,740 | $1,050 | $6,690 |
| 2021 | $412 | $7,740 | $1,050 | $6,690 |
| 2020 | $1,108 | $7,250 | $1,050 | $6,200 |
| 2019 | $1,108 | $7,250 | $1,050 | $6,200 |
| 2018 | $1,904 | $7,250 | $1,050 | $6,200 |
| 2017 | $1,104 | $7,250 | $1,050 | $6,200 |
| 2016 | $433 | $7,250 | $1,050 | $6,200 |
| 2015 | $423 | $7,250 | $1,050 | $6,200 |
| 2014 | $423 | $7,150 | $1,090 | $6,060 |
| 2013 | $417 | $7,150 | $1,090 | $6,060 |
Source: Public Records
Map
Nearby Homes
Your Personal Tour Guide
Ask me questions while you tour the home.