Estimated Value: $89,902 - $213,000
--
Bed
--
Bath
1,126
Sq Ft
$155/Sq Ft
Est. Value
About This Home
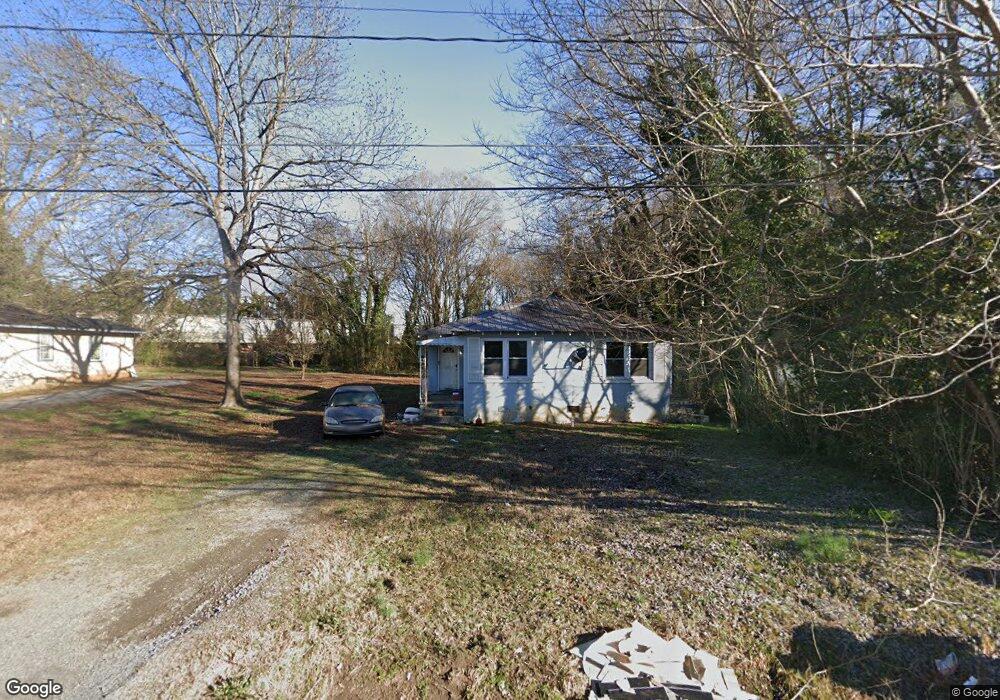
This home is located at 813 Noble St SW, Rome, GA 30161 and is currently estimated at $174,476, approximately $154 per square foot. 813 Noble St SW is a home located in Floyd County with nearby schools including Dan McCarty Middle School, Rome High School, and St. Mary School.
Ownership History
Date
Name
Owned For
Owner Type
Purchase Details
Closed on
Aug 25, 2017
Sold by
Sorrells Kathie W
Bought by
Moss Elizabeth D
Current Estimated Value
Purchase Details
Closed on
Aug 16, 2013
Sold by
Moore Kenneth C
Bought by
Sorrells Kathie W
Purchase Details
Closed on
Jun 30, 2000
Sold by
Moore Billy Chester
Bought by
Moore Kenneth C
Purchase Details
Closed on
Sep 6, 1963
Sold by
Watson Robt J
Bought by
Moore Billy Chester
Purchase Details
Closed on
Jan 1, 1901
Bought by
Watson Robt J
Create a Home Valuation Report for This Property
The Home Valuation Report is an in-depth analysis detailing your home's value as well as a comparison with similar homes in the area
Home Values in the Area
Average Home Value in this Area
Purchase History
| Date | Buyer | Sale Price | Title Company |
|---|---|---|---|
| Moss Elizabeth D | -- | -- | |
| Sorrells Kathie W | $9,000 | -- | |
| Moore Kenneth C | $30,000 | -- | |
| Moore Billy Chester | -- | -- | |
| Watson Robt J | -- | -- |
Source: Public Records
Tax History Compared to Growth
Tax History
| Year | Tax Paid | Tax Assessment Tax Assessment Total Assessment is a certain percentage of the fair market value that is determined by local assessors to be the total taxable value of land and additions on the property. | Land | Improvement |
|---|---|---|---|---|
| 2024 | $1,002 | $25,650 | $8,089 | $17,561 |
| 2023 | $908 | $23,973 | $7,190 | $16,783 |
| 2022 | $712 | $19,515 | $5,842 | $13,673 |
| 2021 | $666 | $17,960 | $5,842 | $12,118 |
| 2020 | $592 | $15,818 | $4,494 | $11,324 |
| 2019 | $557 | $15,040 | $4,494 | $10,546 |
| 2018 | $524 | $14,166 | $4,494 | $9,672 |
| 2017 | $507 | $13,696 | $4,494 | $9,202 |
| 2016 | $496 | $13,360 | $4,480 | $8,880 |
| 2015 | $485 | $13,360 | $4,480 | $8,880 |
| 2014 | $485 | $15,992 | $4,480 | $11,512 |
Source: Public Records
Map
Nearby Homes
- 311 Roswell Ave SE
- 801 Maple Ave SW
- 702 River Ave SW
- 2 Coral Ave SW
- 2 Fair St SW
- 9 Eastridge Ct SW
- 29 Pear St
- 206 E 4th St
- 415 E 10th St SE
- 320 E 3rd Ave
- 211 E 11th St SE
- 312 E 3rd St
- 31 Notasulga Dr SW
- 214 E 3rd St
- 6 Haley Dr SE
- 407 E 3rd St
- 138 E 8th Ave Unit 25
- 202 E 4th Ave Unit 5
- 202 E 4th Ave
- 2 E 10th St SW
- 809 Noble St SW
- 815 Noble St SW
- 807 Noble St SW
- 805 Noble St SW
- 810 Noble St SW
- 812 Noble St SW
- 808 Noble St SW
- 814 Noble St SW
- 1494 Turner McCall Blvd SW
- 806 Noble St SW
- 804 Noble St SW
- 17 Oneill St SW
- 0 O'Neill St SW
- 311 E 7th St SW
- 309 E 7th St SW
- 305 E 7th St SW
- 313 E 7th St SW
- 315 E 7th St SW
- 206 Cooper Dr SE
- 312 Holmes Rd SE