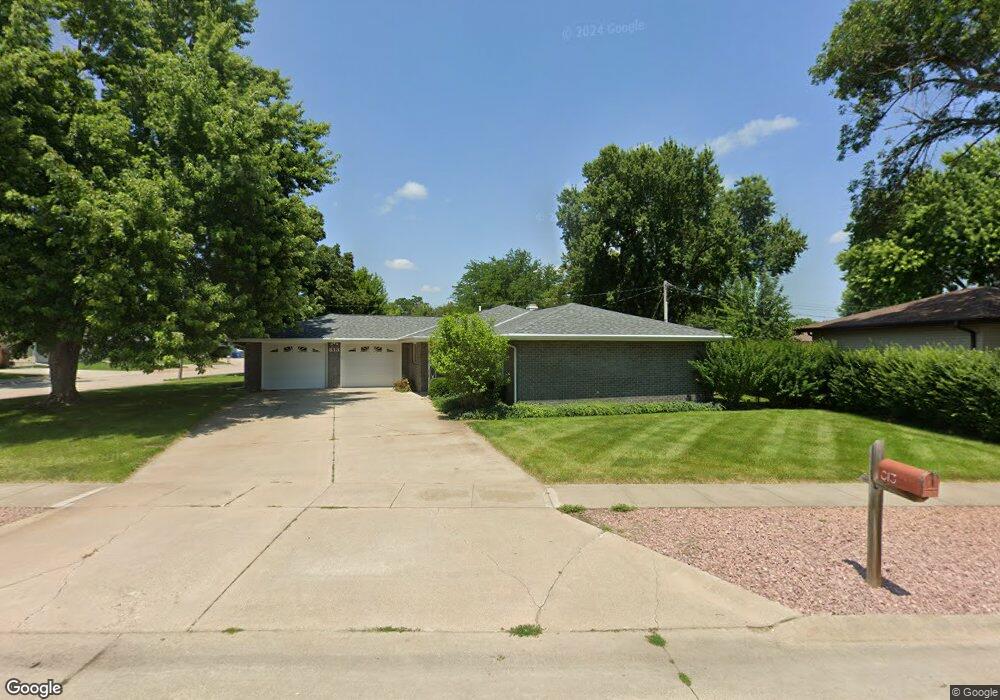
813 Volkman Dr Norfolk, NE 68701
Estimated Value: $244,710 - $305,000
3
Beds
2
Baths
1,652
Sq Ft
$172/Sq Ft
Est. Value
About This Home
This home is located at 813 Volkman Dr, Norfolk, NE 68701 and is currently estimated at $284,678, approximately $172 per square foot. 813 Volkman Dr is a home located in Madison County with nearby schools including Norfolk Senior High School, Christ Lutheran School, and Keystone Christian Academy.
Ownership History
Date
Name
Owned For
Owner Type
Purchase Details
Closed on
Jan 8, 2025
Sold by
Wozniak Richard M and Wozniak Richard M
Bought by
Gcu Llc
Current Estimated Value
Home Financials for this Owner
Home Financials are based on the most recent Mortgage that was taken out on this home.
Original Mortgage
$160,000
Outstanding Balance
$158,889
Interest Rate
6.81%
Mortgage Type
New Conventional
Estimated Equity
$125,789
Purchase Details
Closed on
Jul 9, 2007
Sold by
Hernandez Jr Angela and Hernandez Francisco
Bought by
Wozniak Richard M
Purchase Details
Closed on
Jun 29, 2005
Sold by
Orozco Et Al, Joaquin
Bought by
Hernandez Angela and Hernandez Francisco
Home Financials for this Owner
Home Financials are based on the most recent Mortgage that was taken out on this home.
Original Mortgage
$75,000
Interest Rate
5.64%
Mortgage Type
New Conventional
Create a Home Valuation Report for This Property
The Home Valuation Report is an in-depth analysis detailing your home's value as well as a comparison with similar homes in the area
Home Values in the Area
Average Home Value in this Area
Purchase History
| Date | Buyer | Sale Price | Title Company |
|---|---|---|---|
| Gcu Llc | $155,000 | None Listed On Document | |
| Gcu Llc | $155,000 | None Listed On Document | |
| Wozniak Richard M | $120,000 | -- | |
| Hernandez Angela | $75,000 | -- |
Source: Public Records
Mortgage History
| Date | Status | Borrower | Loan Amount |
|---|---|---|---|
| Open | Gcu Llc | $160,000 | |
| Closed | Gcu Llc | $160,000 | |
| Previous Owner | Hernandez Angela | $75,000 |
Source: Public Records
Tax History Compared to Growth
Tax History
| Year | Tax Paid | Tax Assessment Tax Assessment Total Assessment is a certain percentage of the fair market value that is determined by local assessors to be the total taxable value of land and additions on the property. | Land | Improvement |
|---|---|---|---|---|
| 2024 | $2,427 | $195,480 | $12,466 | $183,014 |
| 2023 | $3,335 | $180,369 | $12,466 | $167,903 |
| 2022 | $3,047 | $162,379 | $12,466 | $149,913 |
| 2021 | $27 | $150,001 | $12,466 | $137,535 |
| 2020 | $27 | $150,001 | $12,466 | $137,535 |
| 2019 | $27 | $138,645 | $12,466 | $126,179 |
| 2018 | $0 | $137,019 | $10,840 | $126,179 |
| 2017 | $0 | $122,086 | $9,426 | $112,660 |
| 2016 | $0 | $114,099 | $8,809 | $105,290 |
| 2015 | $27 | $114,099 | $8,809 | $105,290 |
| 2014 | $61 | $109,085 | $8,809 | $100,276 |
| 2013 | $168 | $109,085 | $8,809 | $100,276 |
Source: Public Records
Map
Nearby Homes
- 804 Volkman Dr
- 501 E Pasewalk Ave
- 606 S Boxelder St
- 809 S 1st St
- 605 E Park Ave
- 506 S 1st St
- 700 S 2nd St
- 922 S 2nd St
- 1104 S 2nd St
- 202 S Birch St
- 910 S Chestnut St
- 1100 Prime Stop Way
- 1001 Prime Stop Way
- 906 S 4th St
- 1303 S 3rd St
- 403 E Norfolk Ave
- 1405 S 2nd St
- 805 S 5th St
- 721 S Victory Rd
- 112 N Birch St
- 803 Volkman Dr
- 823 Volkman Dr
- 801 Volkman Dr
- 820 Volkman Dr
- 814 Volkman Dr
- 822 Volkman Dr
- 812 Volkman Dr
- 824 Volkman Dr
- 810 Volkman Dr
- 816 Volkman Dr
- 818 Volkman Dr
- 802 Volkman Dr
- 808 Volkman Dr
- 809 S Boxelder St
- 811 S Boxelder St
- 806 Volkman Dr
- 807 S Boxelder St
- 815 S Boxelder St
- 901 S Birch St
- 805 S Boxelder St