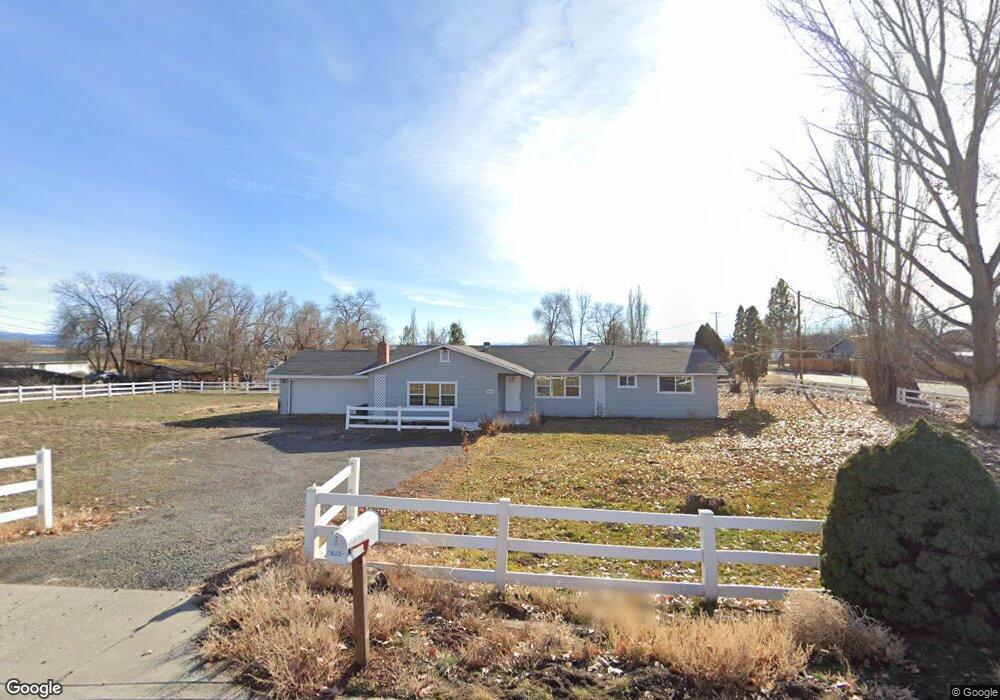
813 W Carlos St Alturas, CA 96101
Estimated Value: $237,000 - $267,359
3
Beds
2
Baths
1,682
Sq Ft
$151/Sq Ft
Est. Value
About This Home
This home is located at 813 W Carlos St, Alturas, CA 96101 and is currently estimated at $254,340, approximately $151 per square foot. 813 W Carlos St is a home located in Modoc County with nearby schools including Modoc High School and New Day Academy.
Ownership History
Date
Name
Owned For
Owner Type
Purchase Details
Closed on
Jan 24, 2024
Sold by
Holmes Jennifer and Holmes Charles
Bought by
Gracza Michael J and Gracza Roseann L
Current Estimated Value
Home Financials for this Owner
Home Financials are based on the most recent Mortgage that was taken out on this home.
Original Mortgage
$101,750
Outstanding Balance
$99,969
Interest Rate
6.95%
Mortgage Type
FHA
Estimated Equity
$154,371
Purchase Details
Closed on
Apr 23, 2014
Sold by
Fredrickson Don and Fredrickson Roxanne
Bought by
Holmes Jennifer and Holmes Charles
Home Financials for this Owner
Home Financials are based on the most recent Mortgage that was taken out on this home.
Original Mortgage
$173,789
Interest Rate
3.25%
Mortgage Type
FHA
Purchase Details
Closed on
Sep 18, 2006
Sold by
Boston Gus M and Boston Shelby L
Bought by
Fredrickson Don and Fredrickson Roxanne
Purchase Details
Closed on
Oct 12, 2004
Sold by
Basic Michael A
Bought by
Boston Gus M and Boston Shelby L
Home Financials for this Owner
Home Financials are based on the most recent Mortgage that was taken out on this home.
Original Mortgage
$100,000
Interest Rate
5.72%
Mortgage Type
Purchase Money Mortgage
Create a Home Valuation Report for This Property
The Home Valuation Report is an in-depth analysis detailing your home's value as well as a comparison with similar homes in the area
Home Values in the Area
Average Home Value in this Area
Purchase History
| Date | Buyer | Sale Price | Title Company |
|---|---|---|---|
| Gracza Michael J | $235,000 | Chicago Title | |
| Holmes Jennifer | $177,000 | Modoc County Title Co | |
| Fredrickson Don | $179,500 | Modoc County Title Co | |
| Boston Gus M | $125,000 | Modoc Co Title Co |
Source: Public Records
Mortgage History
| Date | Status | Borrower | Loan Amount |
|---|---|---|---|
| Open | Gracza Michael J | $101,750 | |
| Previous Owner | Holmes Jennifer | $173,789 | |
| Previous Owner | Boston Gus M | $100,000 |
Source: Public Records
Tax History Compared to Growth
Tax History
| Year | Tax Paid | Tax Assessment Tax Assessment Total Assessment is a certain percentage of the fair market value that is determined by local assessors to be the total taxable value of land and additions on the property. | Land | Improvement |
|---|---|---|---|---|
| 2025 | $2,385 | $239,699 | $41,440 | $198,259 |
| 2024 | $2,385 | $212,713 | $34,439 | $178,274 |
| 2023 | $2,273 | $208,543 | $33,764 | $174,779 |
| 2022 | $2,233 | $204,454 | $33,102 | $171,352 |
| 2021 | $2,192 | $200,446 | $32,453 | $167,993 |
| 2020 | $2,172 | $198,392 | $32,121 | $166,271 |
| 2019 | $2,133 | $194,503 | $31,492 | $163,011 |
| 2018 | $2,095 | $190,690 | $30,875 | $159,815 |
| 2017 | $2,058 | $186,952 | $30,270 | $156,682 |
| 2016 | $2,021 | $183,287 | $29,677 | $153,610 |
| 2015 | $1,993 | $180,535 | $29,232 | $151,303 |
| 2014 | $1,688 | $150,000 | $18,796 | $131,204 |
Source: Public Records
Map
Nearby Homes
- 1732 Pintail Dr
- 003-171-051-001 W Carlos St
- 805 W 2nd St
- 713 W 2nd St
- 0 S Warner St
- 406 W Carlos St
- 607 W 3rd St
- 101 N West A St
- 108 NW A St
- 201 W Carlos St
- 003-253-003 Forrest Ave
- 301 Riverside St
- 206 E Mcdowell Ave
- 1205 W 12th St
- 510 E 2nd St
- 1400 W 11th St
- 701 N East B St
- 1303 Oak St
- 720 E 4th St
- 0 N East A St
- 807 W Carlos St
- 901 W Carlos St
- 803 W Carlos St
- 900 Henderson St
- 903 W Carlos St
- 904 Henderson St
- 809 Henderson St
- 807 Henderson St
- 909 W Carlos St
- 805 Henderson St
- 911 W Carlos St
- 908 Henderson St
- 705 Preston St
- 913 W Carlos St
- 905 Henderson St
- 708 W Carlos St
- 704 Henderson St
- 910 Henderson St
- 914 W Carlos St
- 703 Preston St