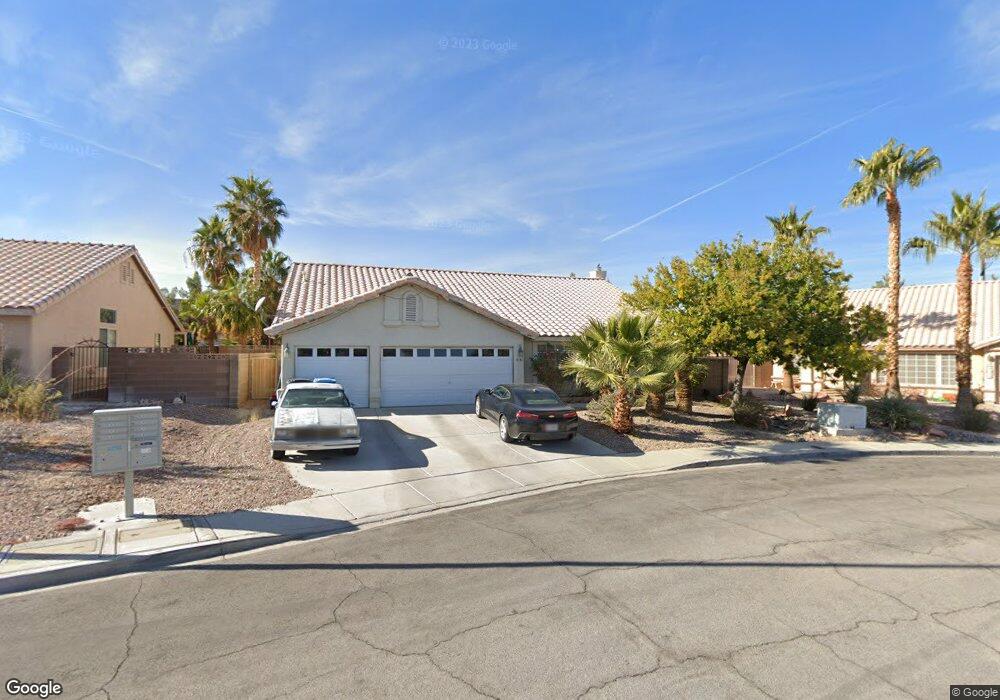
8133 Handle Bar Ln Las Vegas, NV 89123
Silverado Ranch NeighborhoodEstimated Value: $532,000 - $589,000
3
Beds
3
Baths
1,967
Sq Ft
$281/Sq Ft
Est. Value
About This Home
This home is located at 8133 Handle Bar Ln, Las Vegas, NV 89123 and is currently estimated at $552,203, approximately $280 per square foot. 8133 Handle Bar Ln is a home located in Clark County with nearby schools including Aggie Roberts Elementary School, Jack Lund Schofield Middle School, and Silverado High School.
Ownership History
Date
Name
Owned For
Owner Type
Purchase Details
Closed on
Jul 30, 2011
Sold by
Copatch Kendra L and Kelley Kendra L
Bought by
Kopatch Kendra L and Copatch Ryan M
Current Estimated Value
Purchase Details
Closed on
Nov 29, 2004
Sold by
Kelley Kendra L
Bought by
Kelley Kendra L
Home Financials for this Owner
Home Financials are based on the most recent Mortgage that was taken out on this home.
Original Mortgage
$334,229
Outstanding Balance
$175,012
Interest Rate
6.42%
Mortgage Type
Unknown
Estimated Equity
$377,191
Purchase Details
Closed on
Aug 14, 2002
Sold by
Kelley Kristopher K and Kelley Kendra L
Bought by
Kelley Kendra L
Home Financials for this Owner
Home Financials are based on the most recent Mortgage that was taken out on this home.
Original Mortgage
$164,000
Interest Rate
6.52%
Purchase Details
Closed on
Mar 23, 1994
Sold by
Horizon Nevada Inc
Bought by
Kelley Kristopher K and Kelley Kendra L
Home Financials for this Owner
Home Financials are based on the most recent Mortgage that was taken out on this home.
Original Mortgage
$138,850
Interest Rate
7.21%
Create a Home Valuation Report for This Property
The Home Valuation Report is an in-depth analysis detailing your home's value as well as a comparison with similar homes in the area
Home Values in the Area
Average Home Value in this Area
Purchase History
| Date | Buyer | Sale Price | Title Company |
|---|---|---|---|
| Kopatch Kendra L | -- | None Available | |
| Kelley Kendra L | -- | Nevada Title Company | |
| Kelley Kendra L | -- | Fidelity National Title | |
| Kelley Kristopher K | $146,500 | Nevada Title Company |
Source: Public Records
Mortgage History
| Date | Status | Borrower | Loan Amount |
|---|---|---|---|
| Open | Kelley Kendra L | $334,229 | |
| Closed | Kelley Kendra L | $164,000 | |
| Closed | Kelley Kristopher K | $138,850 |
Source: Public Records
Tax History Compared to Growth
Tax History
| Year | Tax Paid | Tax Assessment Tax Assessment Total Assessment is a certain percentage of the fair market value that is determined by local assessors to be the total taxable value of land and additions on the property. | Land | Improvement |
|---|---|---|---|---|
| 2025 | $3,388 | $123,609 | $42,000 | $81,609 |
| 2024 | $3,138 | $123,609 | $42,000 | $81,609 |
| 2023 | $3,138 | $116,281 | $38,850 | $77,431 |
| 2022 | $2,906 | $105,449 | $34,125 | $71,324 |
| 2021 | $2,691 | $101,948 | $33,950 | $67,998 |
| 2020 | $2,495 | $97,716 | $30,100 | $67,616 |
| 2019 | $2,339 | $92,254 | $25,550 | $66,704 |
| 2018 | $2,232 | $85,847 | $21,350 | $64,497 |
| 2017 | $2,540 | $86,600 | $21,000 | $65,600 |
| 2016 | $2,089 | $83,119 | $17,150 | $65,969 |
| 2015 | $2,085 | $76,813 | $14,000 | $62,813 |
| 2014 | $2,020 | $66,823 | $10,500 | $56,323 |
Source: Public Records
Map
Nearby Homes
- 8039 Aspendale Dr
- 8031 Aspendale Dr
- 8056 Martingale Ln
- 7951 Aspendale Dr
- 7868 Brook Valley Dr
- 8235 Coyado St
- 7939 Wishing Well Rd
- 8355 Cabin Peak St
- 1893 Donnington Ct
- 1921 Donnington Ct
- 8190 Fox Tail Way
- 7724 Clearwood Ave
- 1708 Kiwi Ln Unit 1
- 1637 E Robindale Rd
- 7748 Maggie Belle Ct
- 7735 Maggie Belle Ct
- 2251 Bluegrass Ln
- 1982 Zicker Ave
- 1081 Overture Dr
- 1077 Adelman Dr
- 8145 Handle Bar Ln
- 8121 Handle Bar Ln
- 8157 Handle Bar Ln
- 1674 Golden Horizon Dr
- 1691 Golden Horizon Dr
- 1692 Golden Horizon Dr
- 1690 Horizon Sunset Dr
- 8169 Handle Bar Ln
- 1709 Golden Horizon Dr
- 1710 Golden Horizon Dr
- 1708 Horizon Sunset Dr
- 1669 Horizon Sunset Dr
- 1727 Golden Horizon Dr
- 1679 Leatherleaf Dr
- 1695 Leatherleaf Dr
- 1647 Leatherleaf Dr
- 1728 Golden Horizon Dr
- 1687 Horizon Sunset Dr
- 1726 Horizon Sunset Dr
- 1711 Leatherleaf Dr