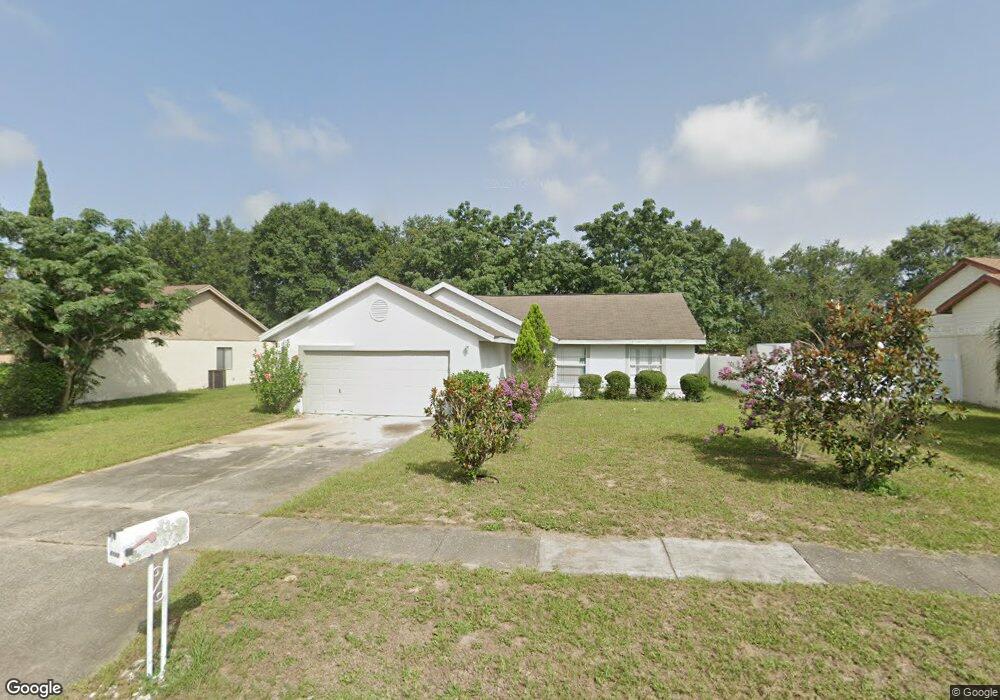
8133 Lesia Cir Orlando, FL 32835
MetroWest NeighborhoodEstimated Value: $335,000 - $346,000
3
Beds
2
Baths
1,200
Sq Ft
$283/Sq Ft
Est. Value
About This Home
This home is located at 8133 Lesia Cir, Orlando, FL 32835 and is currently estimated at $339,368, approximately $282 per square foot. 8133 Lesia Cir is a home located in Orange County with nearby schools including William Frangus Elementary School, Gotha Middle School, and Olympia High.
Ownership History
Date
Name
Owned For
Owner Type
Purchase Details
Closed on
Sep 16, 2019
Sold by
Dulcio Saint Luc
Bought by
Dulcio Soline Desir and Dulcio Hansberg
Current Estimated Value
Purchase Details
Closed on
Mar 22, 2016
Sold by
Guillaume Jules
Bought by
Dulcio Saint Luc and Dulcio Soline Esir
Home Financials for this Owner
Home Financials are based on the most recent Mortgage that was taken out on this home.
Original Mortgage
$97,500
Outstanding Balance
$40,832
Interest Rate
2.95%
Mortgage Type
New Conventional
Estimated Equity
$298,536
Purchase Details
Closed on
Dec 6, 2000
Sold by
Abass Jameer S and Abass Zaheeda
Bought by
Guillaume Jules
Home Financials for this Owner
Home Financials are based on the most recent Mortgage that was taken out on this home.
Original Mortgage
$103,425
Interest Rate
7.71%
Mortgage Type
FHA
Create a Home Valuation Report for This Property
The Home Valuation Report is an in-depth analysis detailing your home's value as well as a comparison with similar homes in the area
Home Values in the Area
Average Home Value in this Area
Purchase History
| Date | Buyer | Sale Price | Title Company |
|---|---|---|---|
| Dulcio Soline Desir | -- | None Available | |
| Dulcio Saint Luc | $122,000 | Alpha Reliable Title Inc | |
| Guillaume Jules | $103,500 | -- |
Source: Public Records
Mortgage History
| Date | Status | Borrower | Loan Amount |
|---|---|---|---|
| Open | Dulcio Saint Luc | $97,500 | |
| Previous Owner | Guillaume Jules | $103,425 |
Source: Public Records
Tax History Compared to Growth
Tax History
| Year | Tax Paid | Tax Assessment Tax Assessment Total Assessment is a certain percentage of the fair market value that is determined by local assessors to be the total taxable value of land and additions on the property. | Land | Improvement |
|---|---|---|---|---|
| 2025 | $4,414 | $266,032 | -- | -- |
| 2024 | $3,983 | $241,847 | -- | -- |
| 2023 | $3,983 | $249,081 | $85,000 | $164,081 |
| 2022 | $3,468 | $200,491 | $75,000 | $125,491 |
| 2021 | $3,119 | $165,185 | $55,000 | $110,185 |
| 2020 | $2,885 | $161,479 | $55,000 | $106,479 |
| 2019 | $2,852 | $155,379 | $48,900 | $106,479 |
| 2018 | $2,649 | $141,807 | $38,000 | $103,807 |
| 2017 | $2,358 | $116,987 | $33,000 | $83,987 |
| 2016 | $1,137 | $114,492 | $30,000 | $84,492 |
| 2015 | $1,151 | $111,135 | $30,000 | $81,135 |
| 2014 | $1,185 | $96,740 | $30,000 | $66,740 |
Source: Public Records
Map
Nearby Homes
- 101 Grove St
- 117 Red Rose Cir
- 119 Killington Way
- 502 S Apopka Vineland Rd
- 551 Wheatstone Place
- 546 Wheatstone Place
- 7748 Pengrove Pass
- 8208 Vineland Oaks Blvd
- 7724 Pengrove Pass
- 286 Mileham Dr
- 232 Sandpiper Ridge Dr
- 8202 Windsor Ridge Rd
- 7717 Pineapple Dr
- 8044 Aspencrest Ct
- 8076 Aspencrest Ct
- 408 Sandpiper Ridge Dr Unit IVD
- 352 Ashbourne Dr
- 7606 Brisbane Ct
- 1044 Nin St
- 7866 Canyon Lake Cir
- 8139 Lesia Cir
- 8127 Lesia Cir Unit 3
- 8121 Lesia Cir
- 8151 Lesia Cir
- 8138 Lesia Cir
- 8138 Lesia Cir Unit 3
- 8126 Lesia Cir
- 8144 Lesia Cir
- 8120 Lesia Cir
- 8115 Lesia Cir
- 8114 Lesia Cir
- 8150 Lesia Cir
- 214 Jemond Ct
- 371 Dempsey Way
- 8109 Lesia Cir
- 202 Jemond Ct Unit 3
- 8102 Lesia Cir
- 220 Jemond Ct
- 365 Dempsey Way
- 354 Dempsey Way