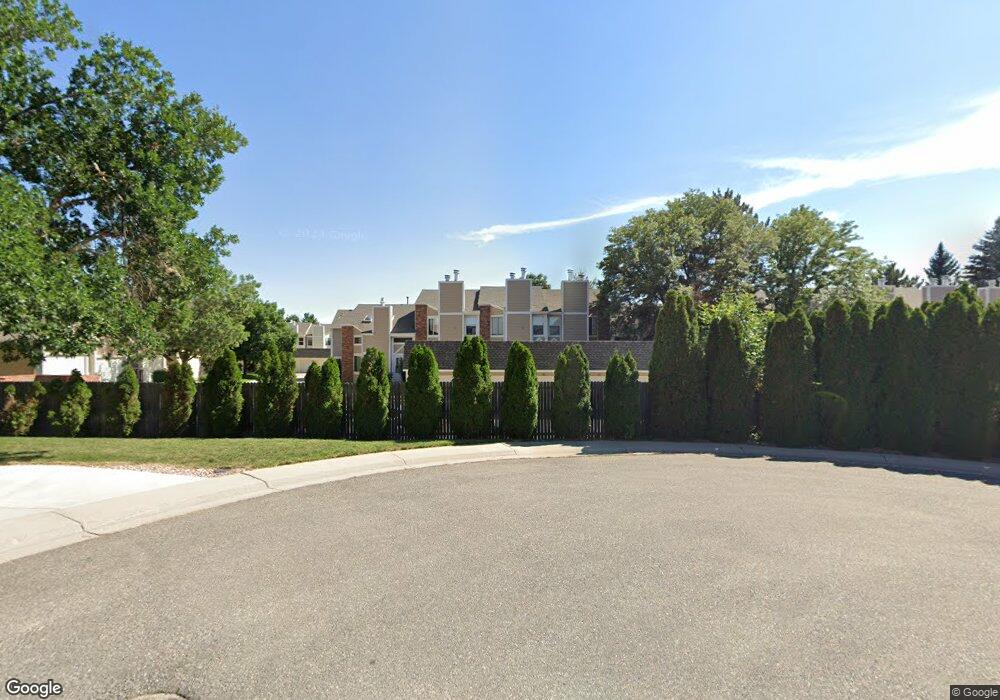
8134 Gray Ct Unit 504 Arvada, CO 80003
Lake Arbor NeighborhoodEstimated Value: $340,000 - $372,000
2
Beds
3
Baths
1,235
Sq Ft
$292/Sq Ft
Est. Value
About This Home
This home is located at 8134 Gray Ct Unit 504, Arvada, CO 80003 and is currently estimated at $361,105, approximately $292 per square foot. 8134 Gray Ct Unit 504 is a home located in Jefferson County with nearby schools including Little Elementary School, Pomona High School, and Face School.
Ownership History
Date
Name
Owned For
Owner Type
Purchase Details
Closed on
Apr 22, 2016
Sold by
Fournier Margo L
Bought by
York Karrie
Current Estimated Value
Home Financials for this Owner
Home Financials are based on the most recent Mortgage that was taken out on this home.
Original Mortgage
$186,400
Outstanding Balance
$148,083
Interest Rate
3.68%
Mortgage Type
New Conventional
Estimated Equity
$213,022
Purchase Details
Closed on
Sep 20, 1996
Sold by
Engsberg Bradley R
Bought by
Fournier Margo L
Home Financials for this Owner
Home Financials are based on the most recent Mortgage that was taken out on this home.
Original Mortgage
$94,591
Interest Rate
7.9%
Mortgage Type
FHA
Purchase Details
Closed on
Sep 15, 1993
Sold by
Duhon Gwendine R
Bought by
Engsberg Bradley R
Home Financials for this Owner
Home Financials are based on the most recent Mortgage that was taken out on this home.
Original Mortgage
$36,500
Interest Rate
7.19%
Create a Home Valuation Report for This Property
The Home Valuation Report is an in-depth analysis detailing your home's value as well as a comparison with similar homes in the area
Home Values in the Area
Average Home Value in this Area
Purchase History
| Date | Buyer | Sale Price | Title Company |
|---|---|---|---|
| York Karrie | $233,000 | Bz Title | |
| Fournier Margo L | $95,000 | -- | |
| Engsberg Bradley R | $68,500 | -- |
Source: Public Records
Mortgage History
| Date | Status | Borrower | Loan Amount |
|---|---|---|---|
| Open | York Karrie | $186,400 | |
| Previous Owner | Fournier Margo L | $94,591 | |
| Previous Owner | Engsberg Bradley R | $36,500 |
Source: Public Records
Tax History
| Year | Tax Paid | Tax Assessment Tax Assessment Total Assessment is a certain percentage of the fair market value that is determined by local assessors to be the total taxable value of land and additions on the property. | Land | Improvement |
|---|---|---|---|---|
| 2024 | $1,929 | $19,883 | $6,030 | $13,853 |
| 2023 | $1,929 | $19,883 | $6,030 | $13,853 |
| 2022 | $1,797 | $18,353 | $4,170 | $14,183 |
| 2021 | $1,827 | $18,881 | $4,290 | $14,591 |
| 2020 | $1,627 | $16,863 | $4,290 | $12,573 |
| 2019 | $1,605 | $16,863 | $4,290 | $12,573 |
| 2018 | $1,421 | $14,515 | $3,600 | $10,915 |
| 2017 | $1,301 | $14,515 | $3,600 | $10,915 |
| 2016 | $1,145 | $12,036 | $2,866 | $9,170 |
| 2015 | $919 | $12,036 | $2,866 | $9,170 |
| 2014 | $919 | $9,075 | $2,229 | $6,846 |
Source: Public Records
Map
Nearby Homes
- 8136 Gray Ct Unit 509
- 8227 Depew Way
- 5690 W 80th Place Unit 98
- 5690 W 80th Place Unit 91
- 5620 W 80th Place Unit 66
- 8250 Chase Way
- 7996 Chase Cir Unit 5
- 7958 Harlan St
- 7936 Eaton St
- 7984 Chase Cir Unit 68
- 7978 Chase Cir Unit B
- 7980 Chase Cir Unit F
- 7977 Chase Cir Unit 47
- 7973 Chase Cir Unit 56
- 7944 Chase Cir Unit 113
- 7917 Chase Cir Unit 160
- 8221 Marshall Ct
- 7936 Marshall Cir
- 6161 W 77th Place
- 8414 Kendall Ct
- 8134 Gray Ct Unit 508
- 8134 Gray Ct Unit 507
- 8134 Gray Ct Unit 506
- 8134 Gray Ct Unit 505
- 8134 Gray Ct
- 8136 Gray Ct Unit 512
- 8136 Gray Ct Unit 511
- 8136 Gray Ct Unit 510
- 8126 Gray Ct Unit 503
- 8126 Gray Ct Unit 502
- 8126 Gray Ct Unit 501
- 8126 Gray Ct Unit 500
- 8126 Gray Ct Unit 1502
- 8124 Gray Ct Unit 498
- 8124 Gray Ct Unit 497
- 8124 Gray Ct Unit 496
- 8124 Gray Ct Unit 495
- 8132 Gray Ct Unit 467
- 8132 Gray Ct Unit 468
- 8132 Gray Ct Unit 469
Your Personal Tour Guide
Ask me questions while you tour the home.