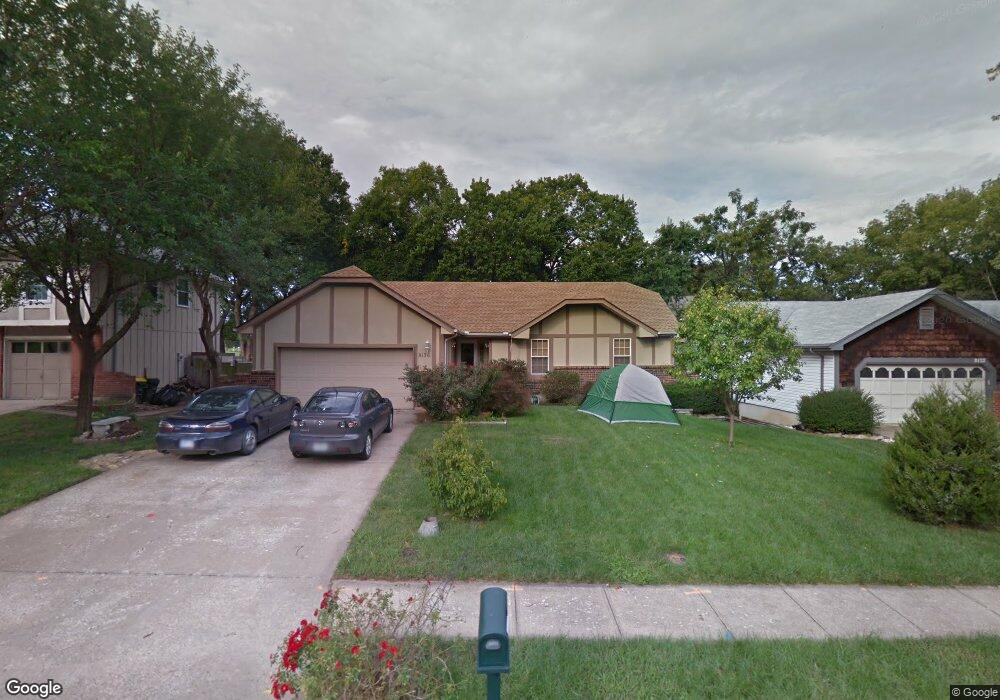
8136 Twilight Ln Lenexa, KS 66219
Estimated Value: $369,676 - $429,000
4
Beds
3
Baths
1,324
Sq Ft
$298/Sq Ft
Est. Value
About This Home
This home is located at 8136 Twilight Ln, Lenexa, KS 66219 and is currently estimated at $394,169, approximately $297 per square foot. 8136 Twilight Ln is a home located in Johnson County with nearby schools including Christa McAuliffe Elementary School, Westridge Middle School, and Shawnee Mission West High School.
Ownership History
Date
Name
Owned For
Owner Type
Purchase Details
Closed on
Jul 7, 2011
Sold by
Lakey Erica
Bought by
Lakey William
Current Estimated Value
Purchase Details
Closed on
Aug 18, 2008
Sold by
Mallory Ronald L and Jaynes Aaron P
Bought by
Lakey William and Lakey Erica
Purchase Details
Closed on
Feb 16, 2005
Sold by
Fitzpatrick Brian T and Fitzpatrick Diane M
Bought by
Mallory Ronald L and Mallory Aaron P
Home Financials for this Owner
Home Financials are based on the most recent Mortgage that was taken out on this home.
Original Mortgage
$136,400
Interest Rate
5.77%
Mortgage Type
New Conventional
Create a Home Valuation Report for This Property
The Home Valuation Report is an in-depth analysis detailing your home's value as well as a comparison with similar homes in the area
Home Values in the Area
Average Home Value in this Area
Purchase History
| Date | Buyer | Sale Price | Title Company |
|---|---|---|---|
| Lakey William | -- | None Available | |
| Lakey William | -- | First American Title Insuran | |
| Mallory Ronald L | -- | All American Title Co |
Source: Public Records
Mortgage History
| Date | Status | Borrower | Loan Amount |
|---|---|---|---|
| Previous Owner | Mallory Ronald L | $136,400 |
Source: Public Records
Tax History
| Year | Tax Paid | Tax Assessment Tax Assessment Total Assessment is a certain percentage of the fair market value that is determined by local assessors to be the total taxable value of land and additions on the property. | Land | Improvement |
|---|---|---|---|---|
| 2025 | $4,479 | $40,653 | $7,787 | $32,866 |
| 2024 | $4,479 | $40,538 | $7,787 | $32,751 |
| 2023 | $4,146 | $36,812 | $6,492 | $30,320 |
| 2022 | $3,880 | $34,420 | $5,902 | $28,518 |
| 2021 | $3,614 | $30,360 | $5,414 | $24,946 |
| 2020 | $3,442 | $28,612 | $5,414 | $23,198 |
| 2019 | $3,358 | $27,900 | $4,520 | $23,380 |
| 2018 | $3,006 | $26,428 | $4,520 | $21,908 |
| 2017 | $3,047 | $24,288 | $3,930 | $20,358 |
| 2016 | $2,926 | $23,023 | $3,744 | $19,279 |
| 2015 | $2,801 | $22,183 | $3,744 | $18,439 |
| 2013 | -- | $20,435 | $3,744 | $16,691 |
Source: Public Records
Map
Nearby Homes
- 8117 Woodstone St
- 15318 W 80th Place
- 14925 W 82nd Terrace
- 16006 W 80th Place
- 8403 Swarner Dr
- 8004 Constance St
- 8443 Alden St
- 7936 Alden St
- 8362 Oakview Cir
- 7736 Darnell St
- 8041 Acuff Ln
- 7619 Twilight Ln
- 7618 Constance St
- 8003 Mullen Rd
- 15514 W 89th St
- 8401 Harbinger St
- 7633 Acuff Ln
- 14621 W 89th St
- 8914 Country Hill Ct
- 7239 Allman Rd
- 8140 Twilight Ln
- 8132 Twilight Ln
- 8204 Twilight Ln
- 15547 W 81st St
- 8128 Twilight Ln
- 15405 W 81st Terrace
- 15326 W 82nd St
- 15543 W 81st St
- 15416 W 81st Terrace
- 15331 W 82nd St
- 15549 W 81st St
- 15331 W 81st Terrace
- 8220 Twilight Ln
- 15410 W 81st Terrace
- 15322 W 82nd St
- 15329 W 82nd St
- 15541 W 81st St
- 15404 W 81st Terrace
- 15551 W 81st St
- 15325 W 81st Terrace
Your Personal Tour Guide
Ask me questions while you tour the home.