8139 Cedar Glen Dr Unit 8139 Charlotte, NC 28212
East Forest NeighborhoodEstimated Value: $124,000 - $160,211
2
Beds
2
Baths
850
Sq Ft
$175/Sq Ft
Est. Value
About This Home
This home is located at 8139 Cedar Glen Dr Unit 8139, Charlotte, NC 28212 and is currently estimated at $148,553, approximately $174 per square foot. 8139 Cedar Glen Dr Unit 8139 is a home located in Mecklenburg County with nearby schools including Greenway Park Elementary, McClintock Middle School, and East Mecklenburg High.
Ownership History
Date
Name
Owned For
Owner Type
Purchase Details
Closed on
Oct 13, 2016
Sold by
Kleijn Adam A and Kleijn Jamie L
Bought by
Dai Mike Y and Liu Ru Ling
Current Estimated Value
Purchase Details
Closed on
May 15, 2012
Sold by
Burns James L
Bought by
Klein Adam A and Klein Jamie L
Purchase Details
Closed on
Mar 5, 2012
Sold by
Allen Nelson Bryant
Bought by
Burns James L
Purchase Details
Closed on
Nov 17, 2011
Sold by
Gmac Mortgage Llc
Bought by
Allen Nelson Bryant
Purchase Details
Closed on
Jun 28, 2011
Sold by
Miller Bruce A
Bought by
Gmac Mortgage Llc
Purchase Details
Closed on
Jun 26, 1998
Sold by
Richard Kudla Vincent
Bought by
Miller Bruce A
Home Financials for this Owner
Home Financials are based on the most recent Mortgage that was taken out on this home.
Original Mortgage
$41,700
Interest Rate
10.02%
Mortgage Type
Purchase Money Mortgage
Create a Home Valuation Report for This Property
The Home Valuation Report is an in-depth analysis detailing your home's value as well as a comparison with similar homes in the area
Home Values in the Area
Average Home Value in this Area
Purchase History
| Date | Buyer | Sale Price | Title Company |
|---|---|---|---|
| Dai Mike Y | $52,500 | None Available | |
| Klein Adam A | $22,000 | Investors Title | |
| Burns James L | $40,000 | None Available | |
| Allen Nelson Bryant | $13,000 | None Available | |
| Gmac Mortgage Llc | $38,214 | None Available | |
| Miller Bruce A | $55,662 | -- |
Source: Public Records
Mortgage History
| Date | Status | Borrower | Loan Amount |
|---|---|---|---|
| Previous Owner | Miller Bruce A | $41,700 |
Source: Public Records
Tax History Compared to Growth
Tax History
| Year | Tax Paid | Tax Assessment Tax Assessment Total Assessment is a certain percentage of the fair market value that is determined by local assessors to be the total taxable value of land and additions on the property. | Land | Improvement |
|---|---|---|---|---|
| 2025 | $1,346 | $157,417 | -- | $157,417 |
| 2024 | $1,346 | $157,417 | -- | $157,417 |
| 2023 | $1,294 | $157,417 | $0 | $157,417 |
| 2022 | $842 | $74,200 | $0 | $74,200 |
| 2021 | $831 | $74,200 | $0 | $74,200 |
| 2020 | $823 | $74,200 | $0 | $74,200 |
| 2019 | $808 | $74,200 | $0 | $74,200 |
| 2018 | $722 | $49,400 | $15,000 | $34,400 |
| 2017 | $702 | $49,400 | $15,000 | $34,400 |
| 2016 | $693 | $49,400 | $15,000 | $34,400 |
| 2015 | -- | $49,400 | $15,000 | $34,400 |
| 2014 | $674 | $59,200 | $15,000 | $44,200 |
Source: Public Records
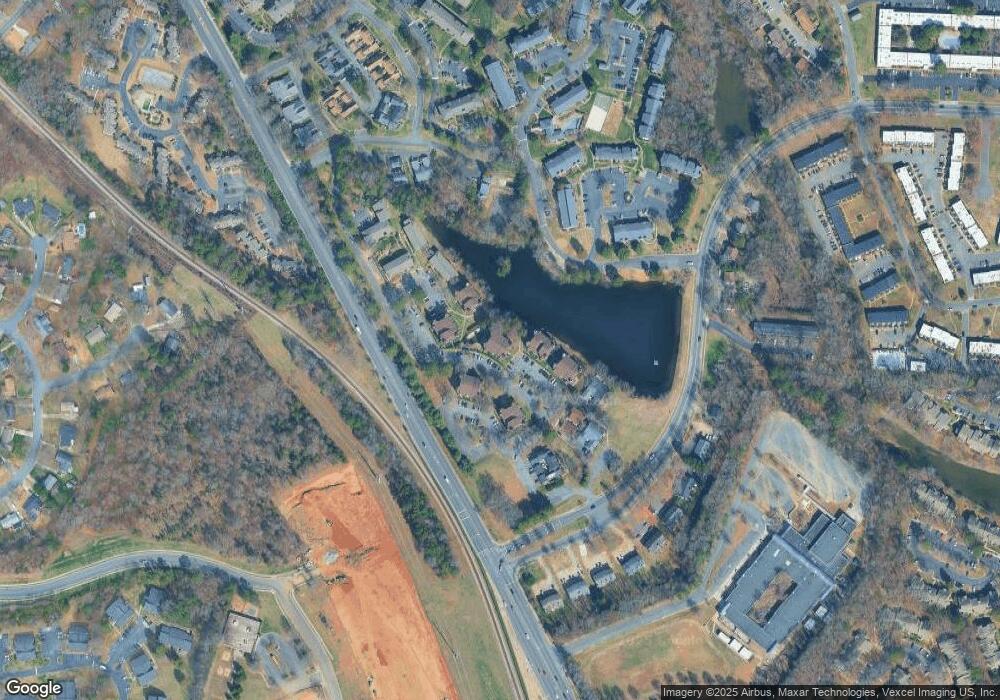
Map
Nearby Homes
- 8069 Cedar Glen Dr Unit 8069
- 8208 Cedar Glen Dr Unit 8208
- 1648 Hollow Dr
- 7336 Pebblestone Dr Unit A
- 7807 Hummingbird Ln
- 7340 Pebblestone Dr Unit C
- 7800 Hummingbird Ln
- 7324 Pebblestone Dr Unit F
- 7324 Pebblestone Dr Unit E
- 7304 Pebblestone Dr
- 6227 Thermal Rd
- 6221 Thermal Rd
- 6201 Thermal Rd
- 7309 Pebblestone Dr Unit D
- 1623 Lumarka Dr
- 2137 Whispering Way
- 2184 Winthrop Chase Dr
- 7700 Candis Dr
- 7018 Rocky Falls Rd
- 2208 Winthrop Chase Dr
- 8139 Cedar Glen Dr Unit n/a
- 8137 Cedar Glen Dr
- 8137 Cedar Glen Dr Unit 8137
- 8133 Cedar Glen Dr
- 8123 Cedar Glen Dr Unit 8123
- 8131 Cedar Glen Dr
- 8121 Cedar Glen Dr
- 8125 Cedar Glen Dr Unit 8125
- 8127 Cedar Glen Dr
- 8129 Cedar Glen Dr Unit 8129
- 8119 Cedar Glen Dr
- 8117 Cedar Glen Dr Unit 8117
- 8151 Cedar Glen Dr Unit 8151
- 8145 Cedar Glen Dr Unit 8145
- 8110 Cedar Glen Dr
- 8147 Cedar Glen Dr Unit 8147
- 8159 Cedar Glen Dr
- 8157 Cedar Glen Dr Unit 8157
- 8161 Cedar Glen Dr Unit 8161
- 8161 Cedar Glen Dr