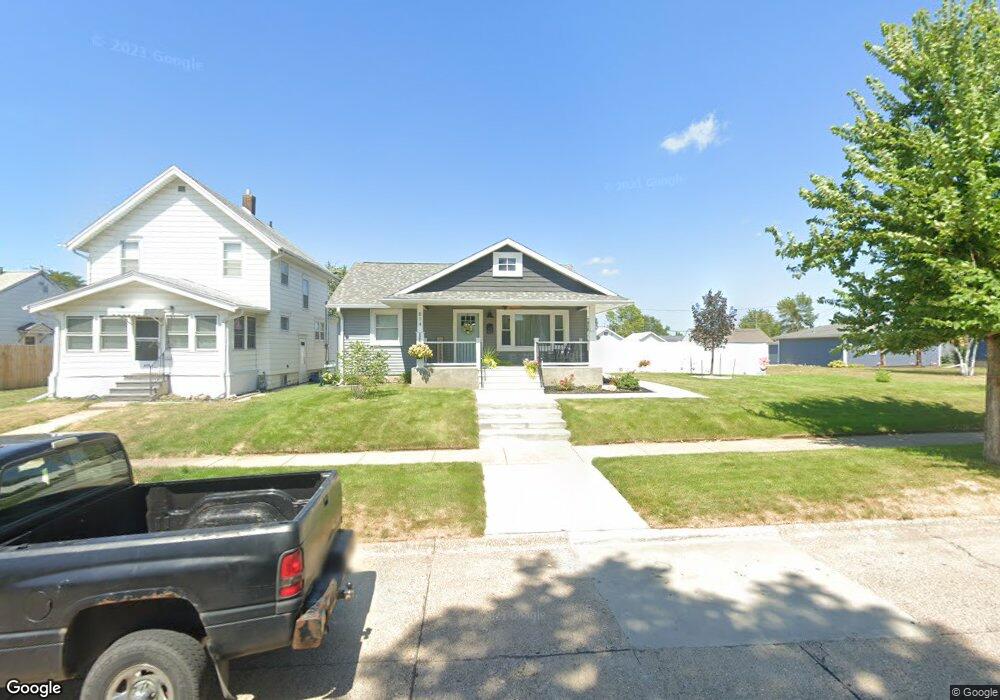
814 21st Ave SW Cedar Rapids, IA 52404
Southwest Area NeighborhoodEstimated Value: $164,000 - $198,000
2
Beds
1
Bath
1,064
Sq Ft
$175/Sq Ft
Est. Value
About This Home
This home is located at 814 21st Ave SW, Cedar Rapids, IA 52404 and is currently estimated at $185,883, approximately $174 per square foot. 814 21st Ave SW is a home located in Linn County with nearby schools including Junction City Elementary School, Grant Elementary School, and Bruce Hall Day Treatment Center.
Ownership History
Date
Name
Owned For
Owner Type
Purchase Details
Closed on
Oct 20, 2022
Sold by
Pb & J Inc
Bought by
Bulicek Paula
Current Estimated Value
Purchase Details
Closed on
Oct 3, 2019
Sold by
Saathoff John
Bought by
Pb & J Inc
Purchase Details
Closed on
Apr 1, 2019
Sold by
Kelcer Properties Llc
Bought by
Saathoff John
Purchase Details
Closed on
Dec 6, 2013
Sold by
Birch Harold W and Goldsberry Kathy J
Bought by
Kelcer Properties Llc
Home Financials for this Owner
Home Financials are based on the most recent Mortgage that was taken out on this home.
Original Mortgage
$93,500
Interest Rate
4.17%
Mortgage Type
Future Advance Clause Open End Mortgage
Purchase Details
Closed on
Sep 4, 2009
Sold by
Coleman Harold R
Bought by
Birch Harold W and Goldsberry Kathy J
Create a Home Valuation Report for This Property
The Home Valuation Report is an in-depth analysis detailing your home's value as well as a comparison with similar homes in the area
Home Values in the Area
Average Home Value in this Area
Purchase History
| Date | Buyer | Sale Price | Title Company |
|---|---|---|---|
| Bulicek Paula | -- | -- | |
| Bulicek Paula | -- | None Listed On Document | |
| Pb & J Inc | $100,000 | None Available | |
| Saathoff John | $100,000 | None Available | |
| Kelcer Properties Llc | $110,000 | None Available | |
| Birch Harold W | $68,500 | None Available |
Source: Public Records
Mortgage History
| Date | Status | Borrower | Loan Amount |
|---|---|---|---|
| Previous Owner | Kelcer Properties Llc | $93,500 |
Source: Public Records
Tax History Compared to Growth
Tax History
| Year | Tax Paid | Tax Assessment Tax Assessment Total Assessment is a certain percentage of the fair market value that is determined by local assessors to be the total taxable value of land and additions on the property. | Land | Improvement |
|---|---|---|---|---|
| 2025 | $3,374 | $216,500 | $27,600 | $188,900 |
| 2024 | $3,418 | $201,100 | $25,200 | $175,900 |
| 2023 | $3,418 | $201,100 | $25,200 | $175,900 |
| 2022 | $3,030 | $162,100 | $25,200 | $136,900 |
| 2021 | $2,464 | $146,300 | $21,600 | $124,700 |
| 2020 | $2,464 | $111,700 | $20,400 | $91,300 |
| 2019 | $1,950 | $90,500 | $20,400 | $70,100 |
| 2018 | $1,896 | $90,500 | $20,400 | $70,100 |
| 2017 | $1,960 | $90,000 | $20,400 | $69,600 |
| 2016 | $1,914 | $90,000 | $20,400 | $69,600 |
| 2015 | $1,968 | $92,487 | $20,400 | $72,087 |
| 2014 | $1,968 | $92,487 | $20,400 | $72,087 |
| 2013 | $1,926 | $92,487 | $20,400 | $72,087 |
Source: Public Records
Map
Nearby Homes
- 826 21st Ave SW
- 648 22nd Ave SW
- 1621 9th St SW
- 1617 9th St SW
- 657 16th Ave SW
- 1132 21st Ave SW
- 815 15th Ave SW
- 1424 9th St SW
- 2417 Illinois St SW
- 1227 19th Ave SW
- 1121 15th Ave SW
- 2511 Indiana St SW
- 1424 11th St SW
- 1426 N St SW
- 1435 N St SW
- 1318 22nd Ave SW
- 1312 Wilson Ave SW
- 1332 Wilson Ave SW
- 1323 M St SW
- 2536 L St SW
- 816 21st Ave SW
- 800 21st Ave SW
- 2008 8th St SW
- 811 20th Ave SW
- 815 20th Ave SW
- 805 20th Ave SW
- 817 20th Ave SW
- 830 21st Ave SW
- 821 20th Ave SW
- 815 21st Ave SW
- 811 21st Ave SW
- 825 20th Ave SW
- 801 20th Ave SW
- 819 21st Ave SW
- 662 21st Ave SW
- 821 21st Ave SW
- 2100 8th St SW
- 831 21st Ave SW
- 827 21st Ave SW
- 656 21st Ave SW