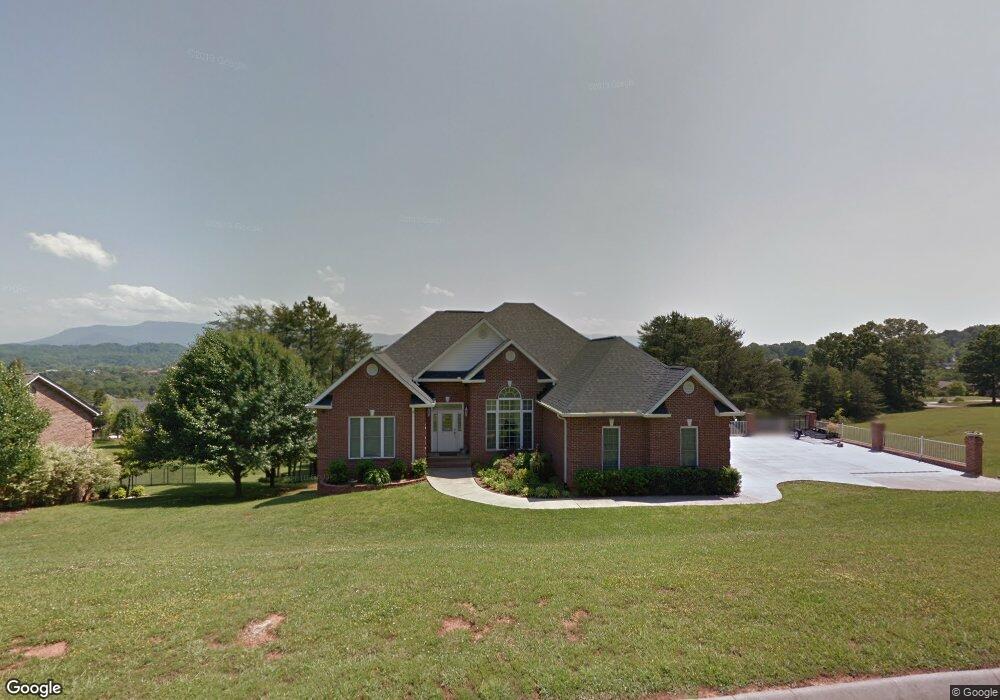
814 Bridle Ct Seymour, TN 37865
Estimated Value: $646,214 - $721,000
4
Beds
3
Baths
3,919
Sq Ft
$174/Sq Ft
Est. Value
About This Home
This home is located at 814 Bridle Ct, Seymour, TN 37865 and is currently estimated at $683,607, approximately $174 per square foot. 814 Bridle Ct is a home located in Sevier County with nearby schools including Northview Elementary School, Catons Chapel Elementary School, and Jones Cove Elementary School.
Ownership History
Date
Name
Owned For
Owner Type
Purchase Details
Closed on
Jul 21, 2011
Sold by
Walker Alyson R
Bought by
Frank Timothy G and Frank Tracy R
Current Estimated Value
Home Financials for this Owner
Home Financials are based on the most recent Mortgage that was taken out on this home.
Original Mortgage
$218,850
Outstanding Balance
$150,633
Interest Rate
4.52%
Mortgage Type
Commercial
Estimated Equity
$532,974
Purchase Details
Closed on
Aug 26, 2005
Sold by
Wilson John
Bought by
Walker Alyson R
Home Financials for this Owner
Home Financials are based on the most recent Mortgage that was taken out on this home.
Original Mortgage
$263,078
Interest Rate
5.71%
Purchase Details
Closed on
Feb 21, 2003
Bought by
Wilson John and Wilson Tania
Purchase Details
Closed on
Apr 29, 1995
Bought by
Large Michael and Large Tena D
Create a Home Valuation Report for This Property
The Home Valuation Report is an in-depth analysis detailing your home's value as well as a comparison with similar homes in the area
Home Values in the Area
Average Home Value in this Area
Purchase History
| Date | Buyer | Sale Price | Title Company |
|---|---|---|---|
| Frank Timothy G | $291,800 | -- | |
| Walker Alyson R | $330,500 | -- | |
| Wilson John | $25,500 | -- | |
| Large Michael | $18,500 | -- |
Source: Public Records
Mortgage History
| Date | Status | Borrower | Loan Amount |
|---|---|---|---|
| Open | Frank Timothy G | $218,850 | |
| Previous Owner | Large Michael | $263,078 | |
| Previous Owner | Large Michael | $42,954 |
Source: Public Records
Tax History Compared to Growth
Tax History
| Year | Tax Paid | Tax Assessment Tax Assessment Total Assessment is a certain percentage of the fair market value that is determined by local assessors to be the total taxable value of land and additions on the property. | Land | Improvement |
|---|---|---|---|---|
| 2025 | $1,395 | $94,250 | $8,625 | $85,625 |
| 2024 | $1,395 | $94,250 | $8,625 | $85,625 |
| 2023 | $1,395 | $94,250 | $0 | $0 |
| 2022 | $1,395 | $94,250 | $8,625 | $85,625 |
| 2021 | $1,395 | $94,250 | $8,625 | $85,625 |
| 2020 | $1,412 | $94,250 | $8,625 | $85,625 |
| 2019 | $1,412 | $75,925 | $8,625 | $67,300 |
| 2018 | $1,412 | $75,925 | $8,625 | $67,300 |
| 2017 | $1,412 | $75,925 | $8,625 | $67,300 |
| 2016 | $1,412 | $75,925 | $8,625 | $67,300 |
| 2015 | -- | $84,075 | $0 | $0 |
| 2014 | $1,370 | $84,068 | $0 | $0 |
Source: Public Records
Map
Nearby Homes
- 0 Sundial Ln
- 828 Berkley Ct
- 850 Trinity View Cir
- 525 Hills Gate Cir
- 0 Golden Harvest Cir
- 816 Vigil Dr
- Lot 34 Pioneer Dr
- 557 Smoky Valley Ln
- 0 W Union Valley Rd
- 1108 Estates Dr
- 129 Huskey Cir
- Lot 3 Boyds Creek Hwy
- 104 Huskey Cir
- 865 Wade Rd
- 320 Chilhowee School Rd
- 903 Amy St
- 534 Boyds Creek Hwy
- 120 S Pitner Rd
- 809 Reagan View Ln
- 1207 Fagley Dr
- 818 Bridle Ct
- 813 Bridle Ct
- 804 Bridle Ct
- 740 Clydesdale Ave
- 821 Bridle Ct
- 0 Clydesdale Ave Unit 973833
- 0 Clydesdale Ave Unit LOT 21 1155382
- 0 Clydesdale Ave Unit LOT 20
- 827 Bridle Ct
- 735 Clydesdale Ave
- 754 Clydesdale Ave
- 760 Clydesdale Ave
- 729 Clydesdale Ave
- 720 Clydesdale Ave
- 828 Bridle Ct
- 725 Clydesdale Ave
- 831 Bridle Ct
- 766 Clydesdale Ave
- 546 S Old Sevierville Pike
- 721 Clydesdale Ave