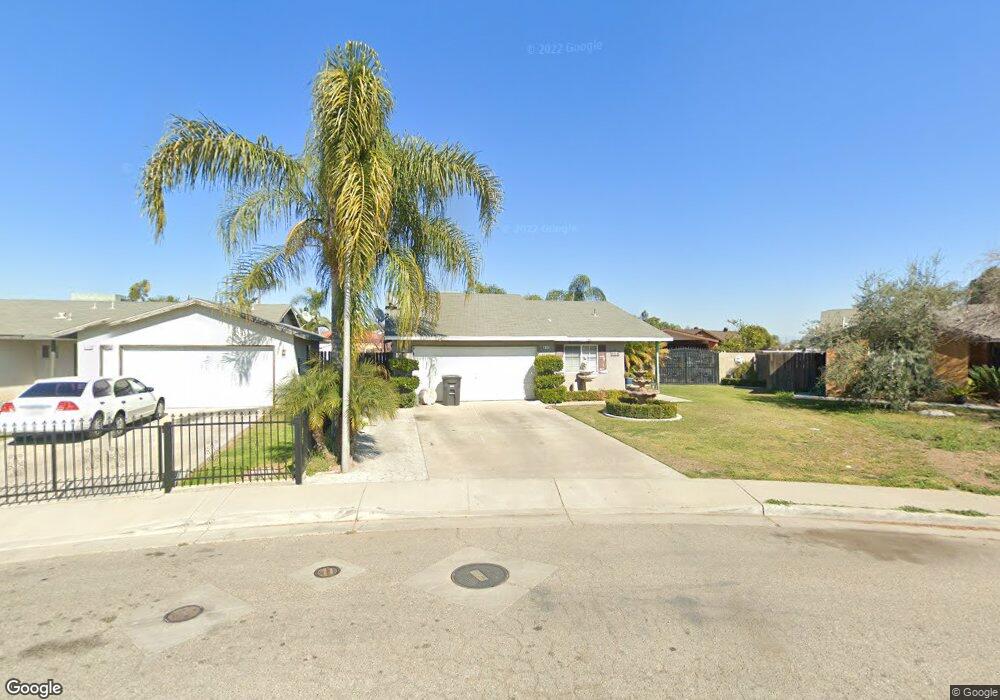
814 Brittany St Unit 1 Shafter, CA 93263
Estimated Value: $266,000 - $343,000
3
Beds
2
Baths
1,139
Sq Ft
$273/Sq Ft
Est. Value
About This Home
This home is located at 814 Brittany St Unit 1, Shafter, CA 93263 and is currently estimated at $310,499, approximately $272 per square foot. 814 Brittany St Unit 1 is a home located in Kern County with nearby schools including Golden Oak Elementary School, Shafter High School, and Grow Academy Shafter.
Ownership History
Date
Name
Owned For
Owner Type
Purchase Details
Closed on
Dec 12, 2003
Sold by
Ayala Anabel
Bought by
Ayala Mario
Current Estimated Value
Home Financials for this Owner
Home Financials are based on the most recent Mortgage that was taken out on this home.
Original Mortgage
$111,780
Outstanding Balance
$51,713
Interest Rate
5.97%
Mortgage Type
FHA
Estimated Equity
$258,786
Purchase Details
Closed on
Nov 14, 2003
Sold by
Hernandez Pablo
Bought by
Ayala Mario
Home Financials for this Owner
Home Financials are based on the most recent Mortgage that was taken out on this home.
Original Mortgage
$111,780
Outstanding Balance
$51,713
Interest Rate
5.97%
Mortgage Type
FHA
Estimated Equity
$258,786
Purchase Details
Closed on
Aug 17, 2001
Sold by
Hernandez Jose and Hernandez Pablo
Bought by
Hernandez Pablo
Purchase Details
Closed on
Dec 19, 1995
Sold by
Hernandez Maria
Bought by
Hernandez Pablo
Purchase Details
Closed on
Aug 8, 1995
Sold by
Lewis Development Inc
Bought by
Hernandez Jose and Hernandez Pablo
Home Financials for this Owner
Home Financials are based on the most recent Mortgage that was taken out on this home.
Original Mortgage
$80,000
Interest Rate
7.18%
Create a Home Valuation Report for This Property
The Home Valuation Report is an in-depth analysis detailing your home's value as well as a comparison with similar homes in the area
Home Values in the Area
Average Home Value in this Area
Purchase History
| Date | Buyer | Sale Price | Title Company |
|---|---|---|---|
| Ayala Mario | -- | Fidelity Title | |
| Ayala Mario | $113,000 | Fidelity Title | |
| Hernandez Pablo | -- | -- | |
| Hernandez Pablo | -- | First American Title Ins Co | |
| Hernandez Jose | $79,500 | First American Title Ins Co |
Source: Public Records
Mortgage History
| Date | Status | Borrower | Loan Amount |
|---|---|---|---|
| Open | Ayala Mario | $111,780 | |
| Previous Owner | Hernandez Jose | $80,000 |
Source: Public Records
Tax History Compared to Growth
Tax History
| Year | Tax Paid | Tax Assessment Tax Assessment Total Assessment is a certain percentage of the fair market value that is determined by local assessors to be the total taxable value of land and additions on the property. | Land | Improvement |
|---|---|---|---|---|
| 2025 | $2,114 | $160,325 | $28,423 | $131,902 |
| 2024 | $2,047 | $157,182 | $27,866 | $129,316 |
| 2023 | $2,047 | $154,101 | $27,320 | $126,781 |
| 2022 | $1,976 | $151,081 | $26,785 | $124,296 |
| 2021 | $1,911 | $148,119 | $26,260 | $121,859 |
| 2020 | $1,857 | $146,601 | $25,991 | $120,610 |
| 2019 | $1,854 | $146,601 | $25,991 | $120,610 |
| 2018 | $1,785 | $140,911 | $24,983 | $115,928 |
| 2017 | $1,775 | $138,149 | $24,494 | $113,655 |
| 2016 | $1,673 | $135,441 | $24,014 | $111,427 |
| 2015 | $1,562 | $127,000 | $32,000 | $95,000 |
| 2014 | $1,410 | $116,000 | $29,000 | $87,000 |
Source: Public Records
Map
Nearby Homes
- 164 Rodriguez Ave
- 700 S Shafter Ave Unit 115
- 9418 Laurelwood Ct
- 9211 Woodbrook Dr
- 137 W Ash Ave
- 116 Winters Dr
- 111 Planada Dr
- 403 W Euclid Ave
- 408 W Euclid Ave
- 187 E Orange Ave
- 249 E Marengo Ave
- 209 Pacific Ave
- 188 N Wall St
- 208 California Ave
- 0 Beech Ave Unit IG25056068
- 0 Lerdo Hwy Unit 202506871
- 0 Beech Ave Unit 202305944
- 421 Boese St
- 0 Los Angeles St
- 436 N Reiker St
- 310 Fair Haven Ave Unit 1
- 820 Brittany St
- 815 Albert St
- 248 Jessie Ave
- 821 Albert St
- 318 Fair Haven Ave
- 305 W Los Angeles Ave
- 826 Brittany St Unit 1
- 315 W Los Angeles Ave
- 257 W Los Angeles Ave
- 827 Albert St
- 240 Jessie Ave
- 321 W Los Angeles Ave
- 326 Fair Haven Ave
- 832 Brittany St Unit 1
- 249 W Los Angeles Ave
- 823 Brittany St
- 833 Albert St
- 329 W Los Angeles Ave Unit 1
- 829 Brittany St Unit 1