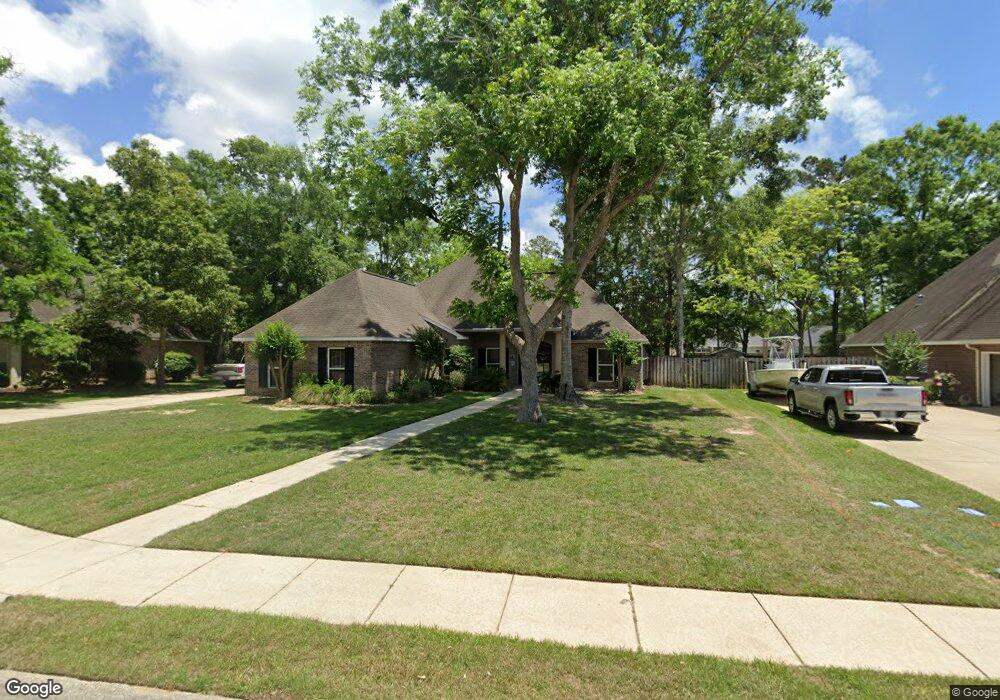
814 Canebreak Dr Ocean Springs, MS 39564
Estimated Value: $390,000 - $518,000
--
Bed
3
Baths
2,332
Sq Ft
$191/Sq Ft
Est. Value
About This Home
This home is located at 814 Canebreak Dr, Ocean Springs, MS 39564 and is currently estimated at $444,410, approximately $190 per square foot. 814 Canebreak Dr is a home located in Jackson County with nearby schools including Pecan Park Elementary School, Ocean Springs Middle School, and Ocean Springs High School.
Ownership History
Date
Name
Owned For
Owner Type
Purchase Details
Closed on
Oct 31, 2019
Sold by
Myers Mark J
Bought by
Arnold Eric
Current Estimated Value
Home Financials for this Owner
Home Financials are based on the most recent Mortgage that was taken out on this home.
Original Mortgage
$260,000
Outstanding Balance
$228,960
Interest Rate
3.65%
Mortgage Type
New Conventional
Estimated Equity
$215,450
Purchase Details
Closed on
Mar 28, 2019
Sold by
Myers Mark J and Myers Betty M
Bought by
Myers Mark J
Purchase Details
Closed on
Nov 14, 2016
Sold by
Lee Pamela D
Bought by
Myers Betty M and Myers Mark J
Home Financials for this Owner
Home Financials are based on the most recent Mortgage that was taken out on this home.
Original Mortgage
$305,500
Interest Rate
3.47%
Mortgage Type
VA
Create a Home Valuation Report for This Property
The Home Valuation Report is an in-depth analysis detailing your home's value as well as a comparison with similar homes in the area
Home Values in the Area
Average Home Value in this Area
Purchase History
| Date | Buyer | Sale Price | Title Company |
|---|---|---|---|
| Arnold Eric | -- | -- | |
| Myers Mark J | -- | -- | |
| Myers Betty M | -- | Delta Title & Escrow Co |
Source: Public Records
Mortgage History
| Date | Status | Borrower | Loan Amount |
|---|---|---|---|
| Open | Arnold Eric | $260,000 | |
| Previous Owner | Myers Betty M | $305,500 |
Source: Public Records
Tax History Compared to Growth
Tax History
| Year | Tax Paid | Tax Assessment Tax Assessment Total Assessment is a certain percentage of the fair market value that is determined by local assessors to be the total taxable value of land and additions on the property. | Land | Improvement |
|---|---|---|---|---|
| 2024 | $3,617 | $27,173 | $5,257 | $21,916 |
| 2023 | $3,617 | $27,173 | $5,257 | $21,916 |
| 2022 | $3,668 | $27,173 | $5,257 | $21,916 |
| 2021 | $3,664 | $27,531 | $5,257 | $22,274 |
| 2020 | $5,632 | $38,729 | $7,656 | $31,073 |
| 2019 | $3,441 | $25,819 | $5,104 | $20,715 |
| 2018 | $3,422 | $25,819 | $5,104 | $20,715 |
| 2017 | $3,422 | $25,819 | $5,104 | $20,715 |
| 2016 | $3,345 | $25,819 | $5,104 | $20,715 |
| 2015 | $3,177 | $241,680 | $51,040 | $190,640 |
| 2014 | $3,213 | $24,601 | $5,104 | $19,497 |
| 2013 | $3,129 | $24,570 | $5,104 | $19,466 |
Source: Public Records
Map
Nearby Homes
- 3801 Tangerine St
- 9329 Ridgeview Dr
- 210 Bluff Cove
- 9336 Ridgeview Dr
- 0 Persimmon Ave
- 3609 N 7th St
- 3909 Cabildo Place
- 3504 Beachview Dr
- 0 Perryman Rd
- 3425 Beachview Dr
- 1005 Belle Terre Ln
- 1112 Belle Terre Ln
- 1114 Belle Terre Ln
- 3409 N 5th St
- 9321 Coconut Dr
- 3 Maple Woods Ln
- 109 Reynolds Cir
- 139 Booth Cir
- 3301 N 7th St
- 113 Mark Daniel Cir
- 814 Canebrake Dr
- 812 Canebreak Dr
- 812 Canebrake Dr
- 816 Canebreak Dr
- 810 Canebreak Dr
- 810 Canebrake Dr
- 818 Canebrake Dr
- 813 Canebreak Dr
- 811 Canebrake Dr
- 811 Canebreak Dr
- 815 Canebrake Dr
- 809 Canebreak Dr
- 808 Canebreak Dr
- 808 Canebrake Dr
- 817 Canebrake Dr
- 807 Canebreak Dr
- 807 Canebrake Dr
- 119 Spanish Cove Dr
- 819 Canebrake Dr
- 819 Canebrake Dr