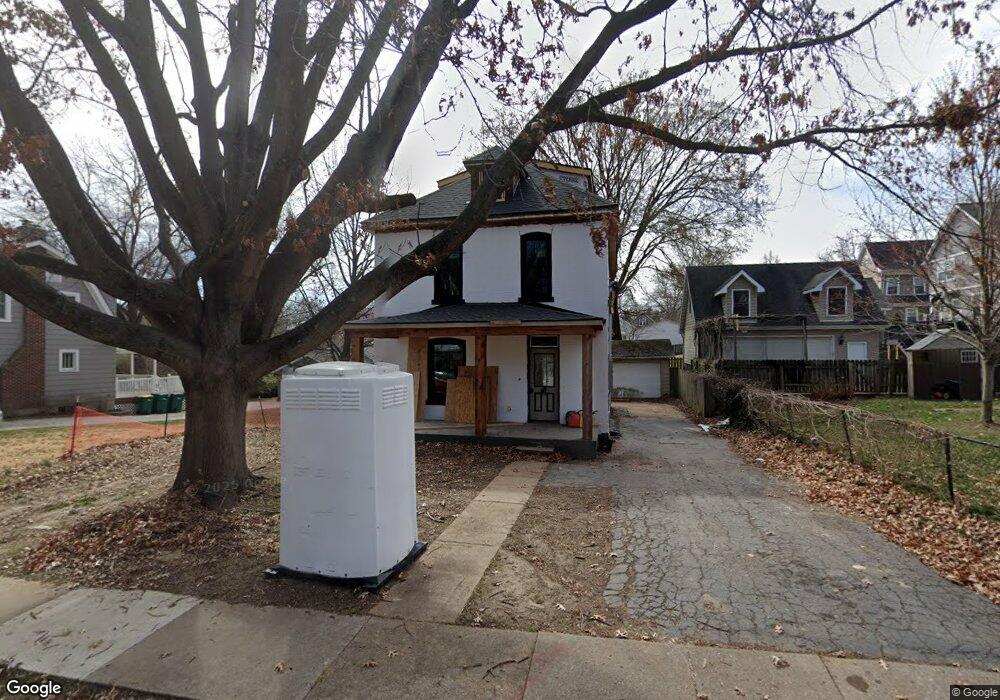
814 Clark Ave Webster Groves, MO 63119
Estimated Value: $284,000 - $412,000
4
Beds
2
Baths
1,619
Sq Ft
$207/Sq Ft
Est. Value
About This Home
This home is located at 814 Clark Ave, Webster Groves, MO 63119 and is currently estimated at $335,628, approximately $207 per square foot. 814 Clark Ave is a home located in St. Louis County with nearby schools including Avery Elementary School, Hixson Middle School, and Webster Groves High School.
Ownership History
Date
Name
Owned For
Owner Type
Purchase Details
Closed on
Oct 10, 2008
Sold by
Hudgins Robert B and Hudgins Chavella C
Bought by
Dwc Enterprises Llc
Current Estimated Value
Purchase Details
Closed on
Jun 7, 2003
Sold by
Eves Roderick D and Peterson Cheryl A
Bought by
Cendant Mobility Government Fincl Svcs C
Home Financials for this Owner
Home Financials are based on the most recent Mortgage that was taken out on this home.
Original Mortgage
$142,500
Interest Rate
5.35%
Mortgage Type
Purchase Money Mortgage
Purchase Details
Closed on
May 14, 2003
Sold by
Cendant Mobility Government Fincl Svcs C
Bought by
Hudgins Robert B and Hudgins Chavella C
Home Financials for this Owner
Home Financials are based on the most recent Mortgage that was taken out on this home.
Original Mortgage
$142,500
Interest Rate
5.35%
Mortgage Type
Purchase Money Mortgage
Purchase Details
Closed on
Aug 17, 1999
Sold by
Bond Michael H and Bond Christy
Bought by
Eves Roderick D and Peterson Cheryl A
Home Financials for this Owner
Home Financials are based on the most recent Mortgage that was taken out on this home.
Original Mortgage
$163,920
Interest Rate
7.68%
Create a Home Valuation Report for This Property
The Home Valuation Report is an in-depth analysis detailing your home's value as well as a comparison with similar homes in the area
Home Values in the Area
Average Home Value in this Area
Purchase History
| Date | Buyer | Sale Price | Title Company |
|---|---|---|---|
| Dwc Enterprises Llc | $144,500 | Clt | |
| Cendant Mobility Government Fincl Svcs C | $187,500 | -- | |
| Hudgins Robert B | $187,500 | -- | |
| Eves Roderick D | $204,900 | -- |
Source: Public Records
Mortgage History
| Date | Status | Borrower | Loan Amount |
|---|---|---|---|
| Previous Owner | Hudgins Robert B | $142,500 | |
| Previous Owner | Eves Roderick D | $163,920 |
Source: Public Records
Tax History Compared to Growth
Tax History
| Year | Tax Paid | Tax Assessment Tax Assessment Total Assessment is a certain percentage of the fair market value that is determined by local assessors to be the total taxable value of land and additions on the property. | Land | Improvement |
|---|---|---|---|---|
| 2025 | $2,455 | $47,480 | $41,650 | $5,830 |
| 2024 | $2,455 | $34,890 | $30,290 | $4,600 |
| 2023 | $2,455 | $68,200 | $30,290 | $37,910 |
| 2022 | $4,484 | $60,040 | $30,290 | $29,750 |
| 2021 | $4,469 | $60,040 | $30,290 | $29,750 |
| 2020 | $4,919 | $61,640 | $30,290 | $31,350 |
| 2019 | $4,884 | $61,640 | $30,290 | $31,350 |
| 2018 | $4,385 | $49,090 | $21,200 | $27,890 |
| 2017 | $4,355 | $49,090 | $21,200 | $27,890 |
| 2016 | $4,240 | $45,750 | $18,160 | $27,590 |
| 2015 | $4,258 | $45,750 | $18,160 | $27,590 |
| 2014 | $4,092 | $42,770 | $13,030 | $29,740 |
Source: Public Records
Map
Nearby Homes
- 874 Tuxedo Blvd
- 808 Greeley Ave
- 544 Summit Ave
- 706 Atalanta Ave
- 685 Clark Ave
- 835 N Forest Ave
- 817 N Forest Ave
- 619 N Bompart Ave
- 946 Newport Ave
- 1016 Marshall Ave
- 804 E Pacific Ave
- 570 N Laclede Station Rd
- 554 N Laclede Station Rd
- 1048 Kuhlman Ln
- 1052 Kuhlman Ln
- 1045 Tuxedo Blvd
- 604 Atalanta Ave
- 1046 Marshall Ave
- 1051 Kuhlman Ln
- 610 Cornelia Ave