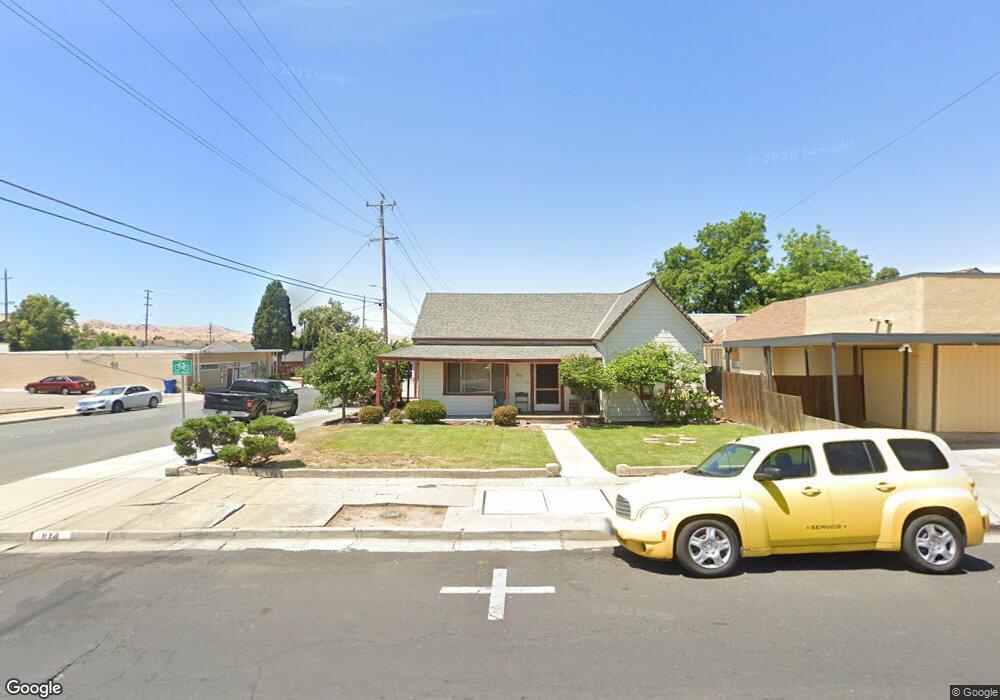
814 G St Antioch, CA 94509
North Antioch NeighborhoodEstimated Value: $445,635 - $505,000
3
Beds
1
Bath
1,792
Sq Ft
$269/Sq Ft
Est. Value
About This Home
This home is located at 814 G St, Antioch, CA 94509 and is currently estimated at $482,409, approximately $269 per square foot. 814 G St is a home located in Contra Costa County with nearby schools including Fremont Elementary School, Antioch Middle School, and Antioch High School.
Ownership History
Date
Name
Owned For
Owner Type
Purchase Details
Closed on
Nov 4, 2014
Sold by
Lamb Thomas M
Bought by
Thomas M & Marilyn S Lamb Family Trust
Current Estimated Value
Purchase Details
Closed on
Apr 17, 2008
Sold by
Lamb Clara M
Bought by
Lamb Clara M and Mccuish Judy E
Purchase Details
Closed on
Aug 3, 1999
Sold by
Lamb Clara M
Bought by
Mccuish Judith E and Lamb Thomas M
Create a Home Valuation Report for This Property
The Home Valuation Report is an in-depth analysis detailing your home's value as well as a comparison with similar homes in the area
Home Values in the Area
Average Home Value in this Area
Purchase History
| Date | Buyer | Sale Price | Title Company |
|---|---|---|---|
| Thomas M & Marilyn S Lamb Family Trust | -- | None Available | |
| Mccuish John G | -- | None Available | |
| Mccuish Judy E | -- | None Available | |
| Lamb Clara M | -- | None Available | |
| Lamb Clara M | -- | None Available | |
| Mccuish Judith E | -- | -- |
Source: Public Records
Tax History
| Year | Tax Paid | Tax Assessment Tax Assessment Total Assessment is a certain percentage of the fair market value that is determined by local assessors to be the total taxable value of land and additions on the property. | Land | Improvement |
|---|---|---|---|---|
| 2025 | $1,167 | $52,790 | $23,997 | $28,793 |
| 2024 | $1,078 | $51,756 | $23,527 | $28,229 |
| 2023 | $1,078 | $50,742 | $23,066 | $27,676 |
| 2022 | $1,068 | $49,748 | $22,614 | $27,134 |
| 2021 | $1,027 | $48,773 | $22,171 | $26,602 |
| 2019 | $986 | $47,328 | $21,514 | $25,814 |
| 2018 | $950 | $46,401 | $21,093 | $25,308 |
| 2017 | $918 | $45,492 | $20,680 | $24,812 |
| 2016 | $877 | $44,601 | $20,275 | $24,326 |
| 2015 | $855 | $43,932 | $19,971 | $23,961 |
| 2014 | $823 | $43,072 | $19,580 | $23,492 |
Source: Public Records
Map
Nearby Homes
- 811 G St Unit 811 and 811 1/2
- 814 F St
- 806 W 7th St
- 710 D St
- 613 W 13th St
- 1143 Cook St
- 819 W 3rd St
- 809 W 2nd St
- 1112 W 6th St
- 1411 C St
- 1516 C St
- 1711 D St
- 307 W 19th St
- 1903 D St
- 327 W 20th St Unit 329
- 1216 Sycamore Dr Unit 4
- 2110 Peppertree Way Unit 1
- 2104 Lemontree Way Unit 1
- 2108 Lemontree Way Unit 3
- 2118 Peppertree Way Unit 1
Your Personal Tour Guide
Ask me questions while you tour the home.