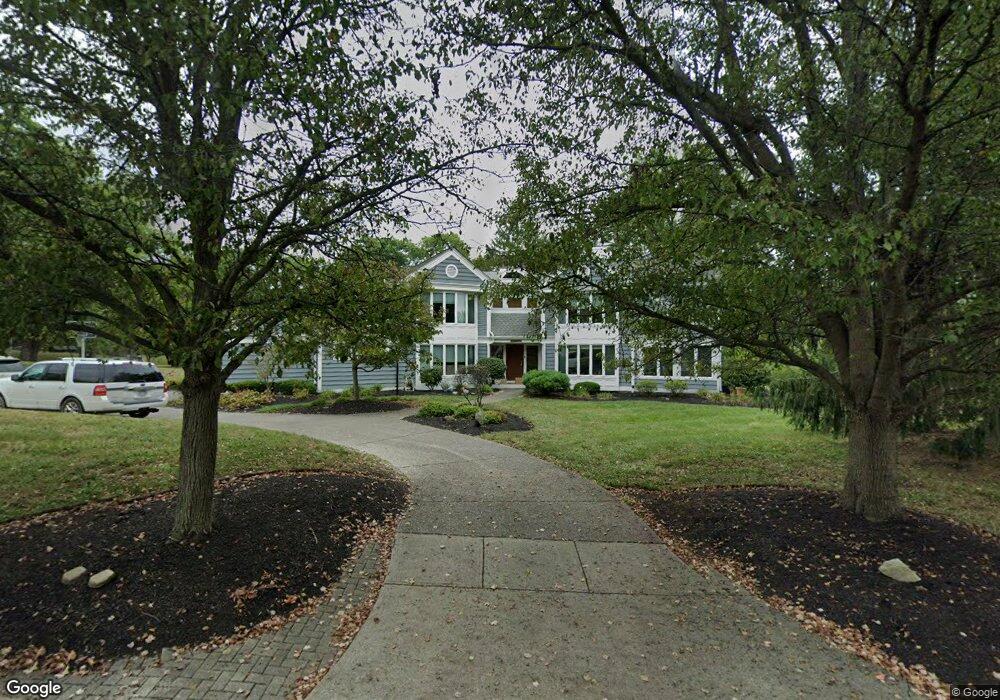
814 Huntersknoll Ln Cincinnati, OH 45230
Estimated Value: $746,668 - $842,000
5
Beds
5
Baths
4,012
Sq Ft
$200/Sq Ft
Est. Value
About This Home
This home is located at 814 Huntersknoll Ln, Cincinnati, OH 45230 and is currently estimated at $801,167, approximately $199 per square foot. 814 Huntersknoll Ln is a home located in Hamilton County with nearby schools including Ayer Elementary School, Nagel Middle School, and Anderson High School.
Ownership History
Date
Name
Owned For
Owner Type
Purchase Details
Closed on
Jun 8, 2004
Sold by
Barrott Helen F and Barrott John C
Bought by
Piehowicz Ii John A and Oconnor Piehowicz Caroline A
Current Estimated Value
Purchase Details
Closed on
May 19, 2003
Sold by
Barrott John C
Bought by
Barrott Helen F
Purchase Details
Closed on
Sep 22, 1998
Sold by
Whitehead Virginia
Bought by
Barrett John C
Purchase Details
Closed on
Oct 27, 1993
Sold by
Whitehead Gary and Whitehead Virginia
Bought by
Whitehead Virginia
Create a Home Valuation Report for This Property
The Home Valuation Report is an in-depth analysis detailing your home's value as well as a comparison with similar homes in the area
Home Values in the Area
Average Home Value in this Area
Purchase History
| Date | Buyer | Sale Price | Title Company |
|---|---|---|---|
| Piehowicz Ii John A | $490,000 | -- | |
| Barrott Helen F | -- | -- | |
| Barrett John C | $336,000 | -- | |
| Whitehead Virginia | -- | -- |
Source: Public Records
Tax History Compared to Growth
Tax History
| Year | Tax Paid | Tax Assessment Tax Assessment Total Assessment is a certain percentage of the fair market value that is determined by local assessors to be the total taxable value of land and additions on the property. | Land | Improvement |
|---|---|---|---|---|
| 2024 | $13,162 | $214,550 | $28,980 | $185,570 |
| 2023 | $12,526 | $214,550 | $28,980 | $185,570 |
| 2022 | $11,014 | $168,277 | $28,476 | $139,801 |
| 2021 | $10,756 | $168,277 | $28,476 | $139,801 |
| 2020 | $10,879 | $168,277 | $28,476 | $139,801 |
| 2019 | $10,606 | $148,918 | $25,200 | $123,718 |
| 2018 | $9,941 | $148,918 | $25,200 | $123,718 |
| 2017 | $9,381 | $148,918 | $25,200 | $123,718 |
| 2016 | $9,308 | $144,347 | $24,990 | $119,357 |
| 2015 | $9,043 | $144,347 | $24,990 | $119,357 |
| 2014 | $9,049 | $144,347 | $24,990 | $119,357 |
| 2013 | $8,160 | $137,473 | $23,800 | $113,673 |
Source: Public Records
Map
Nearby Homes
- 772 Huntersknoll Ln
- 7107 Foxview Dr
- 7343 Ridgepoint Dr
- 845 Eaglesknoll Ct
- 7335 Five Mile Rd
- 7029 Stonington Rd
- 768 Farmsworth Ct
- 993 Rosetree Ln
- 7714 Forest Rd
- 7754 Fox Trail Ln
- 1135 Joetta Dr
- 1132 Rosetree Ln
- 7754 Forest Rd
- 7978 Nagel Village Dr
- 808 Asbury Rd
- 676 Asbury Rd
- 7167 Honeywood Ct
- 1037 Asbury Rd
- 6811 Sunray St
- 1145 Ayershire Ave
- 804 Huntersknoll Ln
- 828 Huntersknoll Ln
- 796 Huntersknoll Ln
- 811 Huntersknoll Ln
- 801 Huntersknoll Ln
- 817 Huntersknoll Ln
- 829 Huntersknoll Ln
- 7289 Woodcroft Dr
- 823 Huntersknoll Ln
- 840 Huntersknoll Ln
- 791 Huntersknoll Ln
- 788 Huntersknoll Ln
- 802 Huntersknoll Ln
- 800 Huntersknoll Ln
- 7291 Woodcroft Dr
- 835 Huntersknoll Ln
- 780 Huntersknoll Ln
- 779 Huntersknoll Ln
- 7275 Woodcroft Dr
- 847 Huntersknoll Ln