Estimated Value: $149,000 - $180,000
4
Beds
2
Baths
1,840
Sq Ft
$92/Sq Ft
Est. Value
About This Home
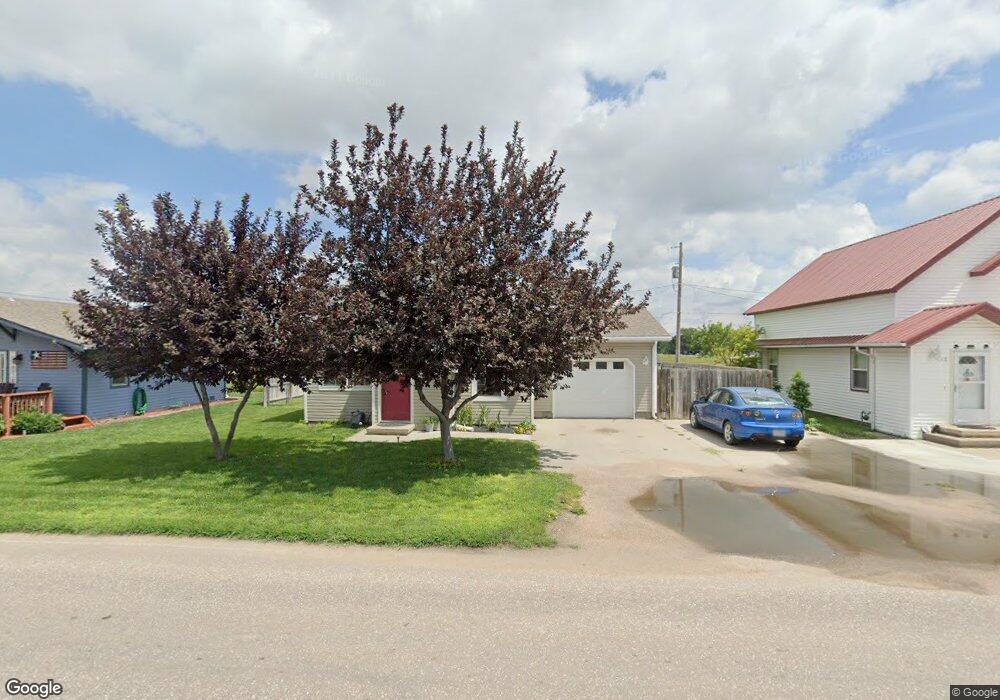
This home is located at 814 Newell St, Cozad, NE 69130 and is currently estimated at $169,588, approximately $92 per square foot. 814 Newell St is a home located in Dawson County with nearby schools including Cozad Elementary School, Cozad Middle School, and Cozad High School.
Ownership History
Date
Name
Owned For
Owner Type
Purchase Details
Closed on
Oct 21, 2022
Sold by
Snyder Joshua J
Bought by
Olbright Sherrie and Steveson Brad
Current Estimated Value
Purchase Details
Closed on
Jul 11, 2016
Sold by
Brill Brandon and Brill Melissa
Bought by
Snyder Joshua J and Snyder Crysten
Home Financials for this Owner
Home Financials are based on the most recent Mortgage that was taken out on this home.
Original Mortgage
$93,059
Interest Rate
3.66%
Mortgage Type
New Conventional
Purchase Details
Closed on
Oct 2, 2012
Sold by
Us Bank Nkational Assn
Bought by
Brill Brandon and Brill Melissa
Home Financials for this Owner
Home Financials are based on the most recent Mortgage that was taken out on this home.
Original Mortgage
$31,600
Interest Rate
3.55%
Mortgage Type
New Conventional
Purchase Details
Closed on
Apr 20, 2010
Sold by
Darling Shawn R and Darling Stacia L
Bought by
Us Bank National Association
Create a Home Valuation Report for This Property
The Home Valuation Report is an in-depth analysis detailing your home's value as well as a comparison with similar homes in the area
Home Values in the Area
Average Home Value in this Area
Purchase History
| Date | Buyer | Sale Price | Title Company |
|---|---|---|---|
| Olbright Sherrie | $130,000 | -- | |
| Snyder Joshua J | $90,000 | None Available | |
| Brill Brandon | $39,500 | None Available | |
| Us Bank National Association | $55,615 | None Available |
Source: Public Records
Mortgage History
| Date | Status | Borrower | Loan Amount |
|---|---|---|---|
| Previous Owner | Snyder Joshua J | $93,059 | |
| Previous Owner | Brill Brandon | $31,600 |
Source: Public Records
Tax History Compared to Growth
Tax History
| Year | Tax Paid | Tax Assessment Tax Assessment Total Assessment is a certain percentage of the fair market value that is determined by local assessors to be the total taxable value of land and additions on the property. | Land | Improvement |
|---|---|---|---|---|
| 2024 | $1,929 | $125,030 | $5,720 | $119,310 |
| 2023 | $2,667 | $123,504 | $5,280 | $118,224 |
| 2022 | $2,212 | $97,829 | $5,280 | $92,549 |
| 2021 | $1,985 | $95,617 | $5,280 | $90,337 |
| 2020 | $1,914 | $91,315 | $5,280 | $86,035 |
| 2019 | $1,865 | $89,415 | $5,280 | $84,135 |
| 2018 | $1,884 | $89,415 | $5,280 | $84,135 |
| 2017 | $1,892 | $89,415 | $5,280 | $84,135 |
| 2016 | $1,943 | $89,415 | $5,280 | $84,135 |
| 2015 | $1,951 | $89,415 | $5,280 | $84,135 |
| 2014 | $1,996 | $88,993 | $5,280 | $83,713 |
| 2013 | -- | $89,145 | $5,280 | $83,865 |
Source: Public Records
Map
Nearby Homes