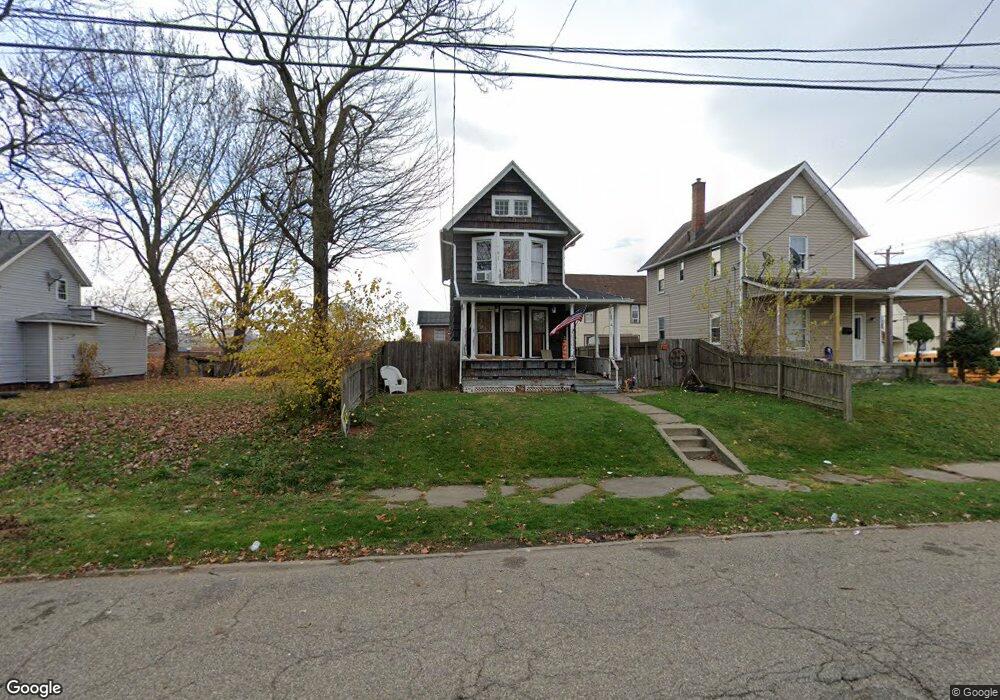
814 Prospect Ave SW Canton, OH 44706
Southwest Canton NeighborhoodEstimated Value: $64,000 - $101,000
2
Beds
1
Bath
1,383
Sq Ft
$65/Sq Ft
Est. Value
About This Home
This home is located at 814 Prospect Ave SW, Canton, OH 44706 and is currently estimated at $89,234, approximately $64 per square foot. 814 Prospect Ave SW is a home located in Stark County with nearby schools including Early Learning Center @ Schreiber, Cedar Elementary School, and McGregor Elementary School.
Ownership History
Date
Name
Owned For
Owner Type
Purchase Details
Closed on
May 24, 2019
Sold by
Festi Bonnie M
Bought by
Petunia Properties Llc
Current Estimated Value
Home Financials for this Owner
Home Financials are based on the most recent Mortgage that was taken out on this home.
Original Mortgage
$15,000
Interest Rate
4.1%
Mortgage Type
New Conventional
Purchase Details
Closed on
Dec 11, 2014
Sold by
Rukavina Michael A and Rukavina Rebeeca L
Bought by
B And L Properties Ltd
Home Financials for this Owner
Home Financials are based on the most recent Mortgage that was taken out on this home.
Original Mortgage
$48,085
Interest Rate
3.97%
Mortgage Type
Seller Take Back
Purchase Details
Closed on
Sep 22, 2008
Sold by
Festi Bonnie M
Bought by
Rukavina Michael A
Home Financials for this Owner
Home Financials are based on the most recent Mortgage that was taken out on this home.
Original Mortgage
$25,900
Interest Rate
7%
Mortgage Type
Seller Take Back
Purchase Details
Closed on
Jul 6, 1989
Create a Home Valuation Report for This Property
The Home Valuation Report is an in-depth analysis detailing your home's value as well as a comparison with similar homes in the area
Home Values in the Area
Average Home Value in this Area
Purchase History
| Date | Buyer | Sale Price | Title Company |
|---|---|---|---|
| Petunia Properties Llc | $13,000 | None Available | |
| B And L Properties Ltd | $48,750 | None Available | |
| Rukavina Michael A | $26,000 | Attorney | |
| -- | $24,000 | -- |
Source: Public Records
Mortgage History
| Date | Status | Borrower | Loan Amount |
|---|---|---|---|
| Closed | Petunia Properties Llc | $15,000 | |
| Previous Owner | B And L Properties Ltd | $48,085 | |
| Previous Owner | Rukavina Michael A | $25,900 |
Source: Public Records
Tax History Compared to Growth
Tax History
| Year | Tax Paid | Tax Assessment Tax Assessment Total Assessment is a certain percentage of the fair market value that is determined by local assessors to be the total taxable value of land and additions on the property. | Land | Improvement |
|---|---|---|---|---|
| 2025 | $683 | $28,500 | $5,640 | $22,860 |
| 2024 | -- | $28,500 | $5,640 | $22,860 |
| 2023 | $705 | $11,550 | $2,730 | $8,820 |
| 2022 | $689 | $11,550 | $2,730 | $8,820 |
| 2021 | $696 | $11,550 | $2,730 | $8,820 |
| 2020 | $632 | $9,390 | $2,280 | $7,110 |
| 2019 | $141 | $9,390 | $2,280 | $7,110 |
| 2018 | $544 | $9,390 | $2,280 | $7,110 |
| 2017 | $572 | $9,000 | $2,380 | $6,620 |
| 2016 | $534 | $8,370 | $2,380 | $5,990 |
| 2015 | $538 | $8,370 | $2,380 | $5,990 |
| 2014 | $631 | $9,250 | $2,630 | $6,620 |
| 2013 | $306 | $9,250 | $2,630 | $6,620 |
Source: Public Records
Map
Nearby Homes
- 719 Prospect Ave SW
- 1016 Clinton Ave SW
- 633 Park Ave SW
- 631 Greenfield Ave SW
- 1021 Greenfield Ave SW
- 1215 Dueber Ave SW
- 1001 Harrison Ave SW
- 1227 Greenfield Ave SW
- 1000 6th St SW
- 2411 Strasser Place SW
- 1009 Arlington Ave SW
- 202 Lincoln Ave NW
- 241 Raymont Ct SW
- 306 Park Ave NW
- 2420 Clyde Place SW
- 2319 Hursh Place NW
- 1356 Margaret Ave SW
- 1370 Lee Ct SW
- 921 Clarendon Ave SW
- 1384 Stark Ave SW
- 812 Prospect Ave SW
- 810 Prospect Ave SW
- 818 Prospect Ave SW
- 1615 9th St SW
- 812 S Prospect(rt 43)
- 806 Prospect Ave SW
- 1611 9th St SW
- 800 Prospect Ave SW
- 900 Prospect Ave SW
- 1607 9th St SW
- 1601 9th St SW
- 1614 9th St SW
- 718 Prospect Ave SW
- 815 Prospect Ave SW
- 817 Prospect Ave SW
- 714 Prospect Ave SW
- 809 Prospect Ave SW
- 807 Prospect Ave SW
- 1610 9th St SW
- 710 Prospect Ave SW