Estimated Value: $108,000 - $137,000
2
Beds
1
Bath
952
Sq Ft
$128/Sq Ft
Est. Value
About This Home
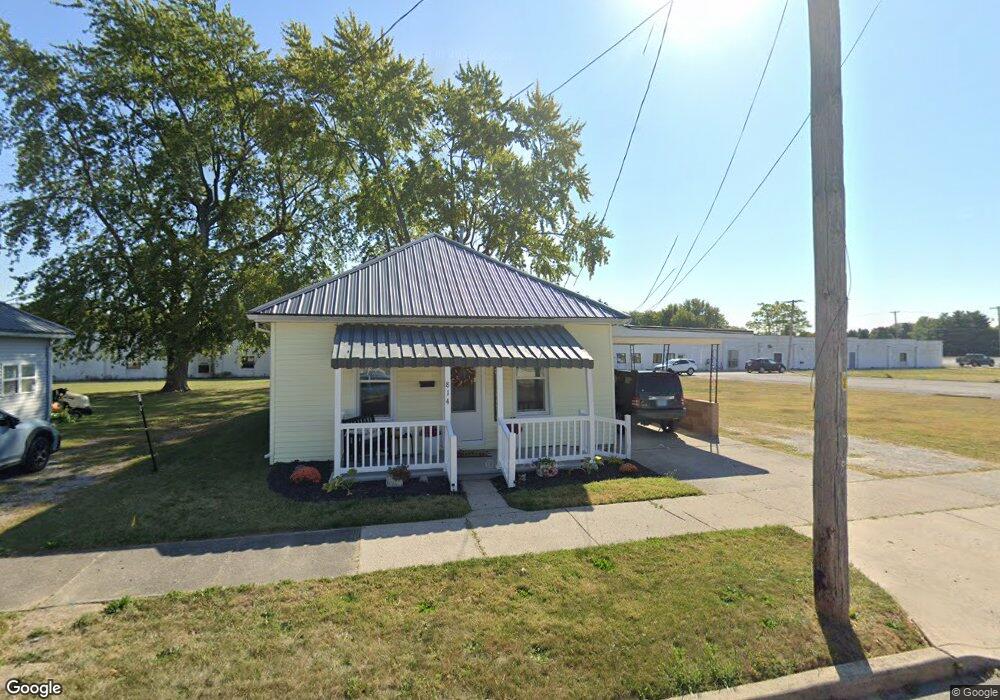
This home is located at 814 S Willow St, Flora, IN 46929 and is currently estimated at $121,580, approximately $127 per square foot. 814 S Willow St is a home located in Carroll County with nearby schools including Carroll Elementary School and Carroll Senior High School.
Ownership History
Date
Name
Owned For
Owner Type
Purchase Details
Closed on
Oct 15, 2025
Sold by
Farrell Zachary Douglas
Bought by
Bygden Oskar Anders
Current Estimated Value
Home Financials for this Owner
Home Financials are based on the most recent Mortgage that was taken out on this home.
Original Mortgage
$7,200
Outstanding Balance
$7,200
Interest Rate
6.5%
Estimated Equity
$114,380
Purchase Details
Closed on
Nov 3, 2023
Sold by
Hbb 1 Llc
Bought by
Farrell Zachary Douglas
Home Financials for this Owner
Home Financials are based on the most recent Mortgage that was taken out on this home.
Original Mortgage
$5,040
Interest Rate
5.4%
Purchase Details
Closed on
Jun 30, 2023
Sold by
Brower Donald Stephen
Bought by
Hbb 1 Llc
Purchase Details
Closed on
Nov 14, 2006
Sold by
Dague Robert E and Dague Phyllis Jean
Bought by
Brower Donald Stephen
Create a Home Valuation Report for This Property
The Home Valuation Report is an in-depth analysis detailing your home's value as well as a comparison with similar homes in the area
Home Values in the Area
Average Home Value in this Area
Purchase History
| Date | Buyer | Sale Price | Title Company |
|---|---|---|---|
| Bygden Oskar Anders | -- | Columbia Title | |
| Farrell Zachary Douglas | -- | Columbia Title | |
| Hbb 1 Llc | -- | Metropolitan Title | |
| Brower Donald Stephen | -- | None Available |
Source: Public Records
Mortgage History
| Date | Status | Borrower | Loan Amount |
|---|---|---|---|
| Open | Bygden Oskar Anders | $7,200 | |
| Open | Bygden Oskar Anders | $116,400 | |
| Previous Owner | Farrell Zachary Douglas | $5,040 | |
| Previous Owner | Farrell Zachary Douglas | $81,480 |
Source: Public Records
Tax History Compared to Growth
Tax History
| Year | Tax Paid | Tax Assessment Tax Assessment Total Assessment is a certain percentage of the fair market value that is determined by local assessors to be the total taxable value of land and additions on the property. | Land | Improvement |
|---|---|---|---|---|
| 2024 | $325 | $68,500 | $15,200 | $53,300 |
| 2023 | $972 | $54,300 | $11,000 | $43,300 |
| 2022 | $972 | $48,600 | $11,000 | $37,600 |
| 2021 | $845 | $42,200 | $11,000 | $31,200 |
| 2020 | $815 | $40,700 | $11,000 | $29,700 |
| 2019 | $811 | $39,300 | $12,300 | $27,000 |
| 2018 | $796 | $38,700 | $12,300 | $26,400 |
| 2017 | $790 | $38,400 | $12,300 | $26,100 |
| 2016 | $763 | $37,100 | $12,300 | $24,800 |
| 2014 | $800 | $40,000 | $10,800 | $29,200 |
Source: Public Records
Map
Nearby Homes
- 810 S Willow St
- 806 S Willow St
- 902 S Willow St
- 809 S Willow St
- 815 S Willow St
- 807 S Willow St
- 905 S Willow St
- 903 S Willow St
- 708 S Willow St
- 711 S Willow St
- 706 S Willow St
- 705 S Willow St
- 704 S Willow St
- 915 S Willow St
- 907 S Center St
- 7 W Hoop St
- 7 W Hoop St
- 7 W Hoop St Unit 9
- 616 S Willow St
- 815 S Center St