Estimated Value: $626,000 - $876,000
3
Beds
2
Baths
1,222
Sq Ft
$588/Sq Ft
Est. Value
About This Home
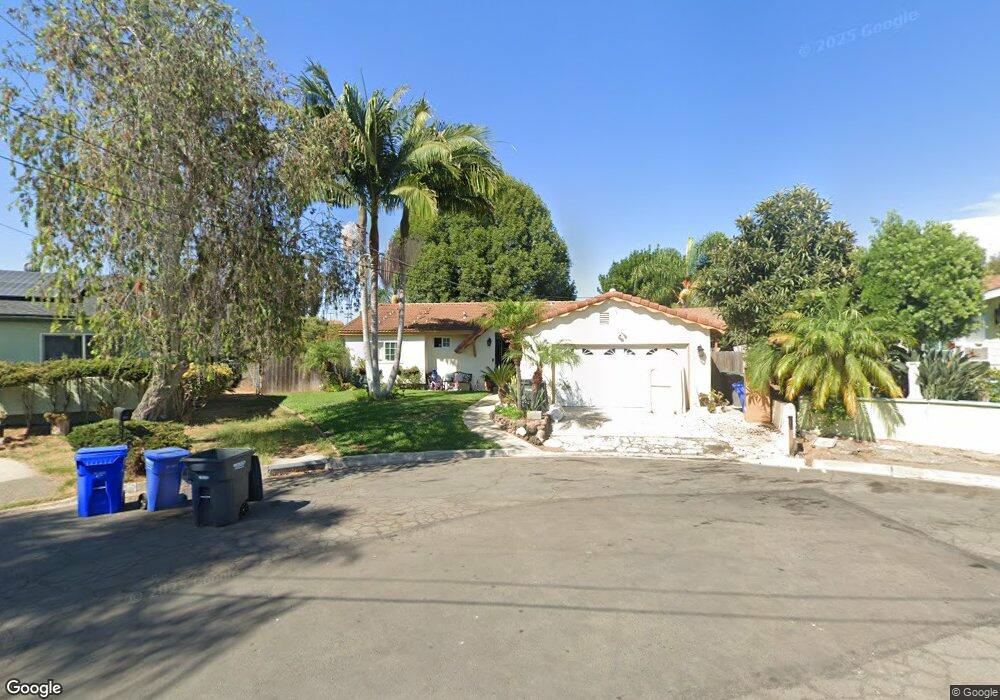
This home is located at 814 Uno Ct, Vista, CA 92084 and is currently estimated at $718,460, approximately $587 per square foot. 814 Uno Ct is a home located in San Diego County with nearby schools including Beaumont Elementary School, Rancho Minerva Middle School, and Vista High School.
Ownership History
Date
Name
Owned For
Owner Type
Purchase Details
Closed on
Dec 11, 2017
Sold by
Sosa Carolina Sanchez and Sanchez Carolina
Bought by
Sosa Carolina Sanchez and Hernandez Jovanna
Current Estimated Value
Home Financials for this Owner
Home Financials are based on the most recent Mortgage that was taken out on this home.
Original Mortgage
$255,000
Outstanding Balance
$214,465
Interest Rate
3.9%
Mortgage Type
New Conventional
Estimated Equity
$503,995
Purchase Details
Closed on
Dec 19, 2002
Sold by
Sanchez Carolina and Sanchez Celerino
Bought by
Sanchez Carolina
Home Financials for this Owner
Home Financials are based on the most recent Mortgage that was taken out on this home.
Original Mortgage
$236,292
Interest Rate
5.97%
Mortgage Type
FHA
Purchase Details
Closed on
Dec 4, 1987
Purchase Details
Closed on
Aug 1, 1985
Create a Home Valuation Report for This Property
The Home Valuation Report is an in-depth analysis detailing your home's value as well as a comparison with similar homes in the area
Home Values in the Area
Average Home Value in this Area
Purchase History
| Date | Buyer | Sale Price | Title Company |
|---|---|---|---|
| Sosa Carolina Sanchez | -- | Orange Coast Title Co Socal | |
| Sanchez Carolina | -- | North American Title Co | |
| -- | $102,000 | -- | |
| -- | $78,000 | -- |
Source: Public Records
Mortgage History
| Date | Status | Borrower | Loan Amount |
|---|---|---|---|
| Open | Sosa Carolina Sanchez | $255,000 | |
| Closed | Sanchez Carolina | $236,292 |
Source: Public Records
Tax History Compared to Growth
Tax History
| Year | Tax Paid | Tax Assessment Tax Assessment Total Assessment is a certain percentage of the fair market value that is determined by local assessors to be the total taxable value of land and additions on the property. | Land | Improvement |
|---|---|---|---|---|
| 2025 | $4,804 | $384,904 | $208,671 | $176,233 |
| 2024 | $4,804 | $377,358 | $204,580 | $172,778 |
| 2023 | $4,705 | $369,960 | $200,569 | $169,391 |
| 2022 | $4,693 | $362,707 | $196,637 | $166,070 |
| 2021 | $4,590 | $355,596 | $192,782 | $162,814 |
| 2020 | $4,562 | $351,951 | $190,806 | $161,145 |
| 2019 | $4,498 | $345,051 | $187,065 | $157,986 |
| 2018 | $4,309 | $338,287 | $183,398 | $154,889 |
| 2017 | $3,567 | $331,654 | $179,802 | $151,852 |
| 2016 | $3,481 | $325,152 | $176,277 | $148,875 |
| 2015 | $4,118 | $320,269 | $173,630 | $146,639 |
| 2014 | $3,381 | $313,996 | $170,229 | $143,767 |
Source: Public Records
Map
Nearby Homes
- 750 N Citrus Ave
- 785 Lemon Ave
- 847 Raintree Place
- 1034 Bartlett Dr
- 1046 Bartlett Dr
- 108 East Dr
- 615 Townsite Dr
- 615 Truly Terrace
- 329 Nicole Dr
- 231 Cananea St
- 229 Hillside Terrace
- 820 Frances Dr
- 503 W California Ave
- 647 W California Ave
- 440 W Los Angeles Dr
- 720 W California Ave
- 1015 Anza Ave
- 468-72 W Los Angeles Dr
- 200 Olive Ave Unit 17
- 200 Olive Ave Unit 66
- 808 Uno Ct
- 339 Townsite Dr Unit 41
- 811 Duo Ct
- 333 Townsite Dr
- 819 Uno Ct
- 333-35 Townsite Dr
- 345 Townsite Dr Unit 47
- 327 Townsite Dr Unit 29
- 802 Uno Ct
- 559 E Indian Rock Rd
- 351 Townsite Dr Unit 53
- 813 Uno Ct
- 321323 Townsite Dr
- 803 Duo Ct
- 807 Uno Ct
- 321 Townsite Dr Unit 23
- 321 Townsite Dr
- 321 Townsite Dr
- 577 E Indian Rock Rd
- 812 Duo Ct