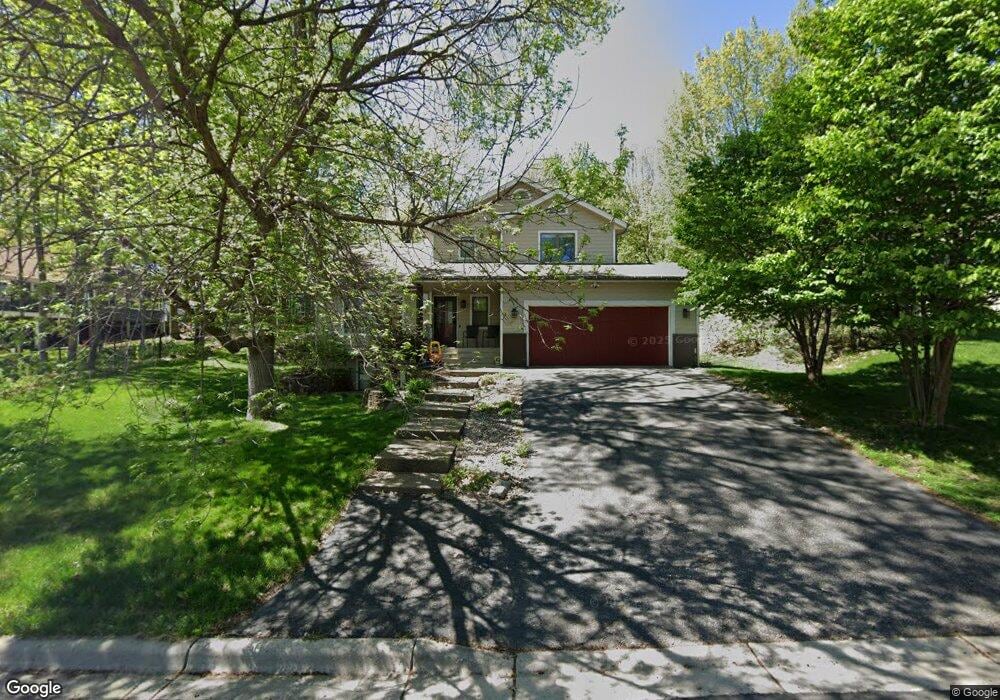
8140 Trillium Cir Victoria, MN 55386
Estimated Value: $469,836 - $515,000
4
Beds
4
Baths
1,884
Sq Ft
$262/Sq Ft
Est. Value
About This Home
This home is located at 8140 Trillium Cir, Victoria, MN 55386 and is currently estimated at $493,959, approximately $262 per square foot. 8140 Trillium Cir is a home located in Carver County with nearby schools including Victoria Elementary School, Chaska Middle School East, and Chanhassen High School.
Ownership History
Date
Name
Owned For
Owner Type
Purchase Details
Closed on
Mar 24, 2017
Sold by
Clayton David R and Clayton Alyssa L
Bought by
Camerino David and Camerino Megan
Current Estimated Value
Home Financials for this Owner
Home Financials are based on the most recent Mortgage that was taken out on this home.
Original Mortgage
$279,632
Outstanding Balance
$231,757
Interest Rate
4.15%
Mortgage Type
VA
Estimated Equity
$262,202
Purchase Details
Closed on
Aug 31, 2005
Sold by
Nelson David P
Bought by
Clayton David R and Clayton Alyssa L
Home Financials for this Owner
Home Financials are based on the most recent Mortgage that was taken out on this home.
Original Mortgage
$306,000
Interest Rate
5.93%
Mortgage Type
New Conventional
Purchase Details
Closed on
Dec 5, 2003
Sold by
Butts Richard L and Butts Patricia D
Bought by
Nelson David P and Nelson Pamela J
Purchase Details
Closed on
Sep 30, 1998
Sold by
Kos Robert D and Kos Debra J
Bought by
Butts Richard L and Butts Patricia D
Create a Home Valuation Report for This Property
The Home Valuation Report is an in-depth analysis detailing your home's value as well as a comparison with similar homes in the area
Home Values in the Area
Average Home Value in this Area
Purchase History
| Date | Buyer | Sale Price | Title Company |
|---|---|---|---|
| Camerino David | $290,000 | Liberty Title Inc | |
| Clayton David R | $340,000 | -- | |
| Nelson David P | $290,000 | -- | |
| Butts Richard L | $195,000 | -- |
Source: Public Records
Mortgage History
| Date | Status | Borrower | Loan Amount |
|---|---|---|---|
| Open | Camerino David | $279,632 | |
| Previous Owner | Clayton David R | $306,000 |
Source: Public Records
Tax History Compared to Growth
Tax History
| Year | Tax Paid | Tax Assessment Tax Assessment Total Assessment is a certain percentage of the fair market value that is determined by local assessors to be the total taxable value of land and additions on the property. | Land | Improvement |
|---|---|---|---|---|
| 2025 | $4,610 | $439,900 | $135,000 | $304,900 |
| 2024 | $4,598 | $423,400 | $125,000 | $298,400 |
| 2023 | $4,480 | $422,100 | $125,000 | $297,100 |
| 2022 | $4,896 | $416,100 | $102,100 | $314,000 |
| 2021 | $4,664 | $322,300 | $85,100 | $237,200 |
| 2020 | $4,742 | $322,300 | $85,100 | $237,200 |
| 2019 | $4,526 | $293,500 | $81,000 | $212,500 |
| 2018 | $4,494 | $293,500 | $81,000 | $212,500 |
| 2017 | $4,622 | $286,800 | $74,300 | $212,500 |
| 2016 | $4,824 | $279,700 | $0 | $0 |
| 2015 | $4,298 | $282,300 | $0 | $0 |
| 2014 | $4,298 | $223,900 | $0 | $0 |
Source: Public Records
Map
Nearby Homes
- 8515 Kelzer Pond Dr
- 8101 Victoria Dr
- 8465 Kelzer Pond Dr
- 1778 Green Crest Dr
- 8345 Grace Ct
- 8064 Narcissus St
- 1240 78th St
- 2735 Heron Ln
- 1255 78th St
- 4106 San Vitero Ln
- 8331 Balsam Ln
- 5055 Kerber Ct
- Itasca Plan at Brookmoore
- Clearwater Plan at Brookmoore
- Bristol Plan at Brookmoore
- Vanderbilt Plan at Brookmoore
- McKinley Plan at Brookmoore
- Springfield Plan at Brookmoore
- 5065 Kerber Ct
- Lewis Plan at Brookmoore
- 8165 Trillium Ln
- 8130 Trillium Cir
- 8145 Trillium Cir
- 8155 Trillium Ln
- 8135 Trillium Cir
- 8120 Trillium Cir
- 8155 Trillium Cir
- 8145 Trillium Ln
- 8125 Trillium Cir
- 8170 Trillium Ln
- 8160 Trillium Ln
- 8110 Trillium Cir
- 8150 Trillium Ln
- 8115 Trillium Cir
- 8177 Trillium Ln
- 8125 81st St
- 8100 Trillium Cir
- 8182 Trillium Ln
- 8105 Trillium Cir
- 8140 Trillium Ln