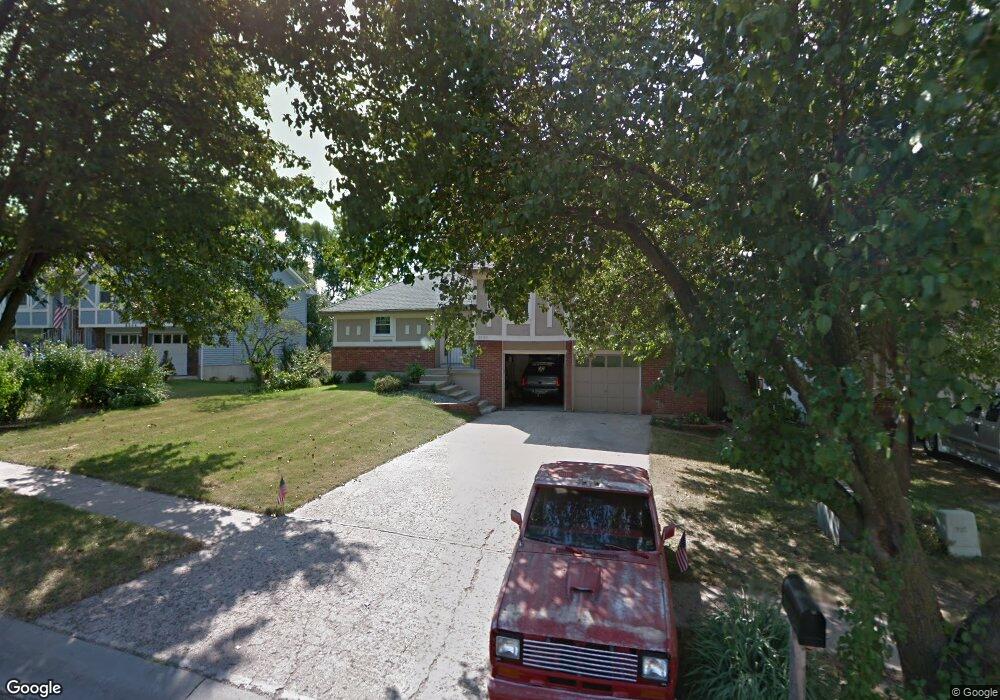
8140 Twilight Ln Lenexa, KS 66219
Estimated Value: $356,056 - $371,000
3
Beds
2
Baths
1,308
Sq Ft
$277/Sq Ft
Est. Value
About This Home
This home is located at 8140 Twilight Ln, Lenexa, KS 66219 and is currently estimated at $362,014, approximately $276 per square foot. 8140 Twilight Ln is a home located in Johnson County with nearby schools including Christa McAuliffe Elementary School, Westridge Middle School, and Shawnee Mission West High School.
Ownership History
Date
Name
Owned For
Owner Type
Purchase Details
Closed on
Nov 13, 2008
Sold by
Basson J Geraldine
Bought by
Coulthard Shawn J and Coulthard Jennifer J
Current Estimated Value
Home Financials for this Owner
Home Financials are based on the most recent Mortgage that was taken out on this home.
Original Mortgage
$136,955
Outstanding Balance
$88,845
Interest Rate
6.18%
Mortgage Type
FHA
Estimated Equity
$273,169
Purchase Details
Closed on
Mar 4, 2004
Sold by
Hornbeck Eric M
Bought by
Basson J Geraldine
Purchase Details
Closed on
Apr 16, 2003
Sold by
Basson J Geraldine
Bought by
Hornbeck Eric
Home Financials for this Owner
Home Financials are based on the most recent Mortgage that was taken out on this home.
Original Mortgage
$135,000
Interest Rate
9.88%
Create a Home Valuation Report for This Property
The Home Valuation Report is an in-depth analysis detailing your home's value as well as a comparison with similar homes in the area
Home Values in the Area
Average Home Value in this Area
Purchase History
| Date | Buyer | Sale Price | Title Company |
|---|---|---|---|
| Coulthard Shawn J | -- | First American Title Ins Co | |
| Basson J Geraldine | -- | -- | |
| Hornbeck Eric | -- | Nations Title Agency Inc |
Source: Public Records
Mortgage History
| Date | Status | Borrower | Loan Amount |
|---|---|---|---|
| Open | Coulthard Shawn J | $136,955 | |
| Previous Owner | Hornbeck Eric | $135,000 |
Source: Public Records
Tax History
| Year | Tax Paid | Tax Assessment Tax Assessment Total Assessment is a certain percentage of the fair market value that is determined by local assessors to be the total taxable value of land and additions on the property. | Land | Improvement |
|---|---|---|---|---|
| 2025 | $4,048 | $35,765 | $7,784 | $27,981 |
| 2023 | $3,889 | $34,523 | $6,491 | $28,032 |
| 2022 | $3,215 | $28,497 | $5,901 | $22,596 |
| 2021 | $3,206 | $26,875 | $5,413 | $21,462 |
| 2020 | $3,022 | $25,058 | $5,413 | $19,645 |
| 2019 | $2,852 | $23,621 | $4,518 | $19,103 |
| 2018 | $2,852 | $23,414 | $4,518 | $18,896 |
| 2017 | $2,679 | $21,298 | $3,928 | $17,370 |
| 2016 | $2,574 | $20,194 | $3,743 | $16,451 |
| 2015 | $2,500 | $19,745 | $3,743 | $16,002 |
| 2013 | -- | $17,790 | $3,743 | $14,047 |
Source: Public Records
Map
Nearby Homes
- 8117 Woodstone St
- 15318 W 80th Place
- 16006 W 80th Place
- 8403 Swarner Dr
- 14925 W 82nd Terrace
- 8443 Alden St
- 8004 Constance St
- 7936 Alden St
- 8362 Oakview Cir
- 7736 Darnell St
- 7619 Twilight Ln
- 8041 Acuff Ln
- 8401 Harbinger St
- 7618 Constance St
- 15514 W 89th St
- 8003 Mullen Rd
- 7633 Acuff Ln
- 8914 Country Hill Ct
- 7239 Allman Rd
- 7221 Allman Rd
- 8204 Twilight Ln
- 8136 Twilight Ln
- 8132 Twilight Ln
- 15547 W 81st St
- 15331 W 82nd St
- 8220 Twilight Ln
- 8128 Twilight Ln
- 15326 W 82nd St
- 15405 W 81st Terrace
- 15329 W 82nd St
- 15549 W 81st St
- 15543 W 81st St
- 8226 Twilight Ln
- 15322 W 82nd St
- 15331 W 81st Terrace
- 15416 W 81st Terrace
- 15321 W 82nd St
- 15551 W 81st St
- 15410 W 81st Terrace
- 15326 W 82nd Terrace
Your Personal Tour Guide
Ask me questions while you tour the home.