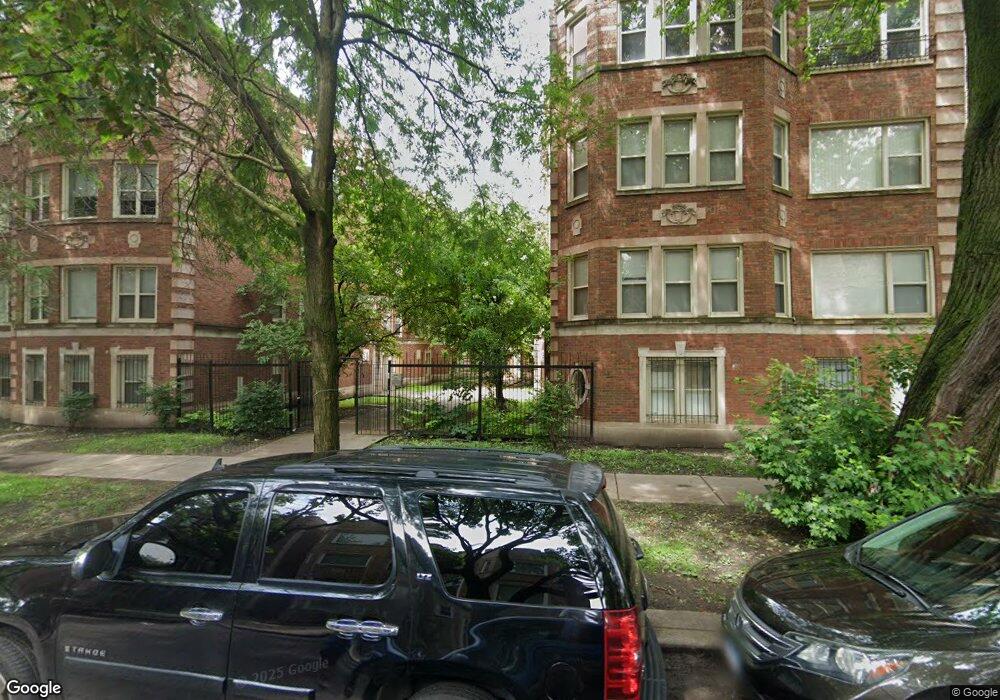
8146 S Drexel Ave Unit 8146G Chicago, IL 60619
Grand Crossing NeighborhoodEstimated Value: $64,000 - $78,000
2
Beds
1
Bath
--
Sq Ft
0.29
Acres
About This Home
This home is located at 8146 S Drexel Ave Unit 8146G, Chicago, IL 60619 and is currently estimated at $67,797. 8146 S Drexel Ave Unit 8146G is a home located in Cook County with nearby schools including Ashe Elementary School, Emil G. Hirsch Metropolitan High School, and Betty Shabazz Academy.
Ownership History
Date
Name
Owned For
Owner Type
Purchase Details
Closed on
Mar 10, 2023
Sold by
Coleman Kimberly Ann
Bought by
Patsy & Cindy Llc
Current Estimated Value
Purchase Details
Closed on
Sep 30, 2022
Sold by
Coleman Renee M
Bought by
Coleman Kimberly Ann
Purchase Details
Closed on
Nov 20, 2012
Sold by
Federal Home Loan Mortgage Corporation
Bought by
Coleman Renee
Purchase Details
Closed on
Jun 22, 2012
Sold by
Singleton Brian
Bought by
Federal Home Loan Mortgage Corporation
Purchase Details
Closed on
May 27, 2005
Sold by
Drexel Investment Group Llc
Bought by
Singleton Brian
Home Financials for this Owner
Home Financials are based on the most recent Mortgage that was taken out on this home.
Original Mortgage
$91,400
Interest Rate
7.87%
Mortgage Type
Fannie Mae Freddie Mac
Create a Home Valuation Report for This Property
The Home Valuation Report is an in-depth analysis detailing your home's value as well as a comparison with similar homes in the area
Home Values in the Area
Average Home Value in this Area
Purchase History
| Date | Buyer | Sale Price | Title Company |
|---|---|---|---|
| Patsy & Cindy Llc | $58,000 | None Listed On Document | |
| Coleman Kimberly Ann | -- | None Listed On Document | |
| Coleman Renee | $16,500 | Attorneys Title Guaranty Fun | |
| Federal Home Loan Mortgage Corporation | -- | None Available | |
| Singleton Brian | $91,500 | Ticor Title Insurance |
Source: Public Records
Mortgage History
| Date | Status | Borrower | Loan Amount |
|---|---|---|---|
| Previous Owner | Singleton Brian | $91,400 |
Source: Public Records
Tax History Compared to Growth
Tax History
| Year | Tax Paid | Tax Assessment Tax Assessment Total Assessment is a certain percentage of the fair market value that is determined by local assessors to be the total taxable value of land and additions on the property. | Land | Improvement |
|---|---|---|---|---|
| 2024 | -- | $5,796 | $333 | $5,463 |
| 2023 | -- | $2,000 | $554 | $1,446 |
| 2022 | $0 | $2,000 | $554 | $1,446 |
| 2021 | $1,129 | $1,999 | $554 | $1,445 |
| 2020 | $1,129 | $8,170 | $398 | $7,772 |
| 2019 | $1,127 | $9,038 | $398 | $8,640 |
| 2018 | $1,107 | $9,038 | $398 | $8,640 |
| 2017 | $1,849 | $8,587 | $354 | $8,233 |
| 2016 | $1,720 | $8,587 | $354 | $8,233 |
| 2015 | $1,574 | $8,587 | $354 | $8,233 |
| 2014 | $1,420 | $7,652 | $332 | $7,320 |
| 2013 | $1,392 | $7,652 | $332 | $7,320 |
Source: Public Records
Map
Nearby Homes
- 8154 S Drexel Ave Unit 3E
- 8142 S Drexel Ave Unit G
- 8140 S Drexel Ave Unit 2W
- 8139 S Drexel Ave
- 854 E 82nd St Unit 2
- 8142 S Maryland Ave
- 8133 S Ingleside Ave
- 8045 S Maryland Ave
- 8118 S Ellis Ave
- 8216 S Maryland Ave
- 8038 S Ingleside Ave
- 8219 S Ingleside Ave
- 8234 S Ingleside Ave
- 8021 S Maryland Ave
- 8253 S Maryland Ave
- 740 E 82nd St
- 9245 S Drexel Ave
- 8258 S Maryland Ave
- 7948 S Drexel Ave
- 936 E 80th St
- 8146 S Drexel Ave Unit 81462
- 8146 S Drexel Ave Unit 81461
- 8146 S Drexel Ave Unit 81463
- 8146 S Drexel Ave Unit 2
- 8146 S Drexel Ave Unit G
- 8144 S Drexel Ave Unit 81442
- 8144 S Drexel Ave Unit 81443
- 8144 S Drexel Ave Unit 81441
- 8144 S Drexel Ave Unit 2
- 8144 S Drexel Ave Unit 1D
- 8144 S Drexel Ave Unit 3
- 8142 S Drexel Ave Unit 3W
- 8142 S Drexel Ave Unit 3E
- 8142 S Drexel Ave Unit 81422W
- 8142 S Drexel Ave Unit 81423E
- 8142 S Drexel Ave Unit 81422E
- 8142 S Drexel Ave Unit 81421E
- 8142 S Drexel Ave Unit 81421W
- 8142 S Drexel Ave Unit 81423W
- 8142 S Drexel Ave Unit 8142G