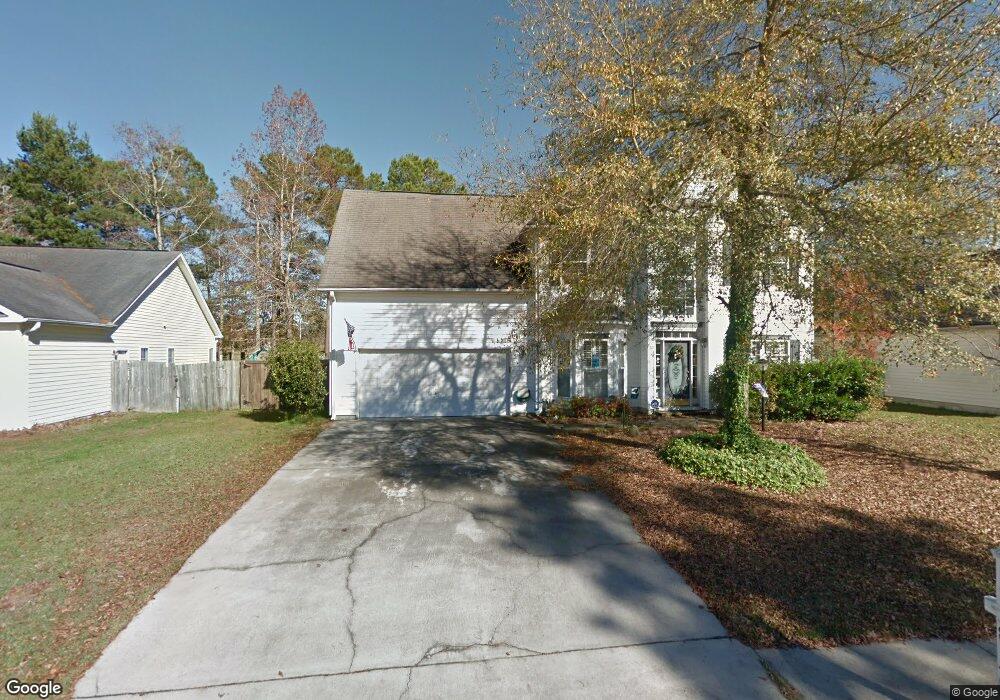
8149 Governors Walk Unit 1 North Charleston, SC 29418
Estimated Value: $408,404 - $434,000
4
Beds
3
Baths
2,053
Sq Ft
$206/Sq Ft
Est. Value
About This Home
This home is located at 8149 Governors Walk Unit 1, North Charleston, SC 29418 and is currently estimated at $423,101, approximately $206 per square foot. 8149 Governors Walk Unit 1 is a home located in Dorchester County with nearby schools including Eagle Nest Elementary School, River Oaks Middle School, and Fort Dorchester High School.
Ownership History
Date
Name
Owned For
Owner Type
Purchase Details
Closed on
Mar 9, 2012
Sold by
Murphy Valerie L
Bought by
Brooks Robert J
Current Estimated Value
Home Financials for this Owner
Home Financials are based on the most recent Mortgage that was taken out on this home.
Original Mortgage
$140,000
Outstanding Balance
$96,262
Interest Rate
3.89%
Mortgage Type
Future Advance Clause Open End Mortgage
Estimated Equity
$326,839
Purchase Details
Closed on
Aug 15, 2006
Sold by
Carlisle Antwan D and Carlisle Joanna
Bought by
Murphy Valerie L
Home Financials for this Owner
Home Financials are based on the most recent Mortgage that was taken out on this home.
Original Mortgage
$184,000
Interest Rate
6.37%
Mortgage Type
Purchase Money Mortgage
Purchase Details
Closed on
Sep 25, 2002
Sold by
Brentwood Homes Of South Carolina Inc
Bought by
Carlisle Antwan D and Carlisle Joanna
Purchase Details
Closed on
May 26, 2000
Sold by
Whipple Development Corp
Bought by
Brentwood Homes Of South Carolina Inc
Create a Home Valuation Report for This Property
The Home Valuation Report is an in-depth analysis detailing your home's value as well as a comparison with similar homes in the area
Home Values in the Area
Average Home Value in this Area
Purchase History
| Date | Buyer | Sale Price | Title Company |
|---|---|---|---|
| Brooks Robert J | $195,000 | -- | |
| Murphy Valerie L | $230,000 | None Available | |
| Carlisle Antwan D | $181,169 | -- | |
| Brentwood Homes Of South Carolina Inc | $125,000 | -- |
Source: Public Records
Mortgage History
| Date | Status | Borrower | Loan Amount |
|---|---|---|---|
| Open | Brooks Robert J | $140,000 | |
| Previous Owner | Murphy Valerie L | $184,000 |
Source: Public Records
Tax History Compared to Growth
Tax History
| Year | Tax Paid | Tax Assessment Tax Assessment Total Assessment is a certain percentage of the fair market value that is determined by local assessors to be the total taxable value of land and additions on the property. | Land | Improvement |
|---|---|---|---|---|
| 2024 | $2,573 | $15,374 | $5,000 | $10,374 |
| 2023 | $2,573 | $9,804 | $2,600 | $7,204 |
| 2022 | $2,278 | $8,770 | $2,300 | $6,470 |
| 2021 | $2,278 | $8,770 | $2,300 | $6,470 |
| 2020 | $2,189 | $8,774 | $2,300 | $6,474 |
| 2019 | $2,158 | $8,774 | $2,300 | $6,474 |
| 2018 | $1,913 | $7,630 | $2,000 | $5,630 |
| 2017 | $1,854 | $7,630 | $2,000 | $5,630 |
| 2016 | $1,854 | $7,630 | $2,000 | $5,630 |
| 2015 | $1,849 | $7,630 | $2,000 | $5,630 |
| 2014 | $1,964 | $207,600 | $0 | $0 |
Source: Public Records
Map
Nearby Homes
- 8157 Governors Walk
- 8328 Berringer Bluff
- 5318 Natures Color Ln
- 8316 Dye Makers
- 5349 Deep Blue Ln
- 8301 Wild Indigo Bluff
- 5540 Indigo Fields Blvd
- 125 Remington Dr
- 104 Excaliber Place
- 110 Marsh Hall Dr
- 116 Excaliber Place
- 136 Old Saybrook Rd
- 112 Mansfield Blvd
- 5417 Ansley Trail
- 128 Mansfield Blvd
- 113 Broadmarsh Ct
- 8250 Longridge Rd
- 3239 Landing Pkwy
- 106 Scottswood Dr
- 5437 River Island Ct
- 8149 Governors Walk
- 8145 Governors Walk
- 8141 Governors Walk
- 8144 Governors Walk
- 8140 Governors Walk
- 8137 Governors Walk
- 8161 Governors Walk
- 8148 Governors Walk
- 5504 Copper Trace
- 8165 Governors Walk
- 5401 Indigo Fields Blvd
- 5399 Indigo Fields Blvd Unit 1
- 5505 Copper Trace
- 5395 Indigo Fields Blvd
- 5405 Indigo Fields Blvd
- 5391 Indigo Fields Blvd
- 5500 Lindo Terrace
- 5508 Copper Trace
- 5409 Indigo Fields Blvd
- 8169 Governors Walk