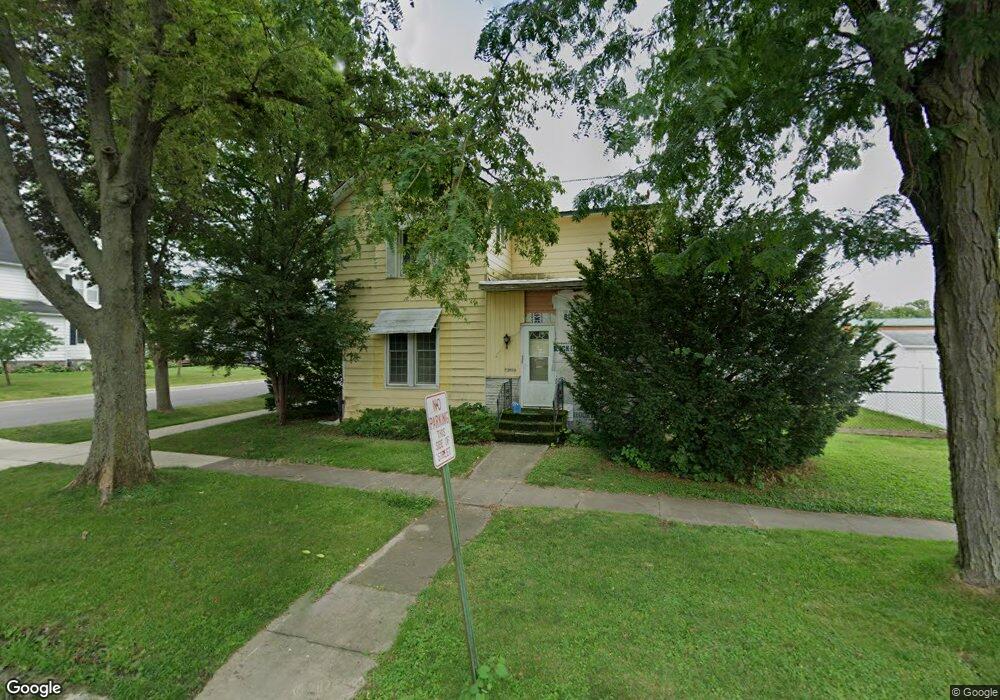
815 A Ave Vinton, IA 52349
Estimated Value: $132,818 - $145,000
3
Beds
2
Baths
1,631
Sq Ft
$86/Sq Ft
Est. Value
About This Home
This home is located at 815 A Ave, Vinton, IA 52349 and is currently estimated at $140,205, approximately $85 per square foot. 815 A Ave is a home located in Benton County with nearby schools including Tilford Elementary School, Shellsburg Elementary School, and Vinton-Shellsburg Middle School.
Ownership History
Date
Name
Owned For
Owner Type
Purchase Details
Closed on
Dec 21, 2007
Sold by
Abbott Tracie Neustel and Abbott Matthew
Bought by
Rouse Roger
Current Estimated Value
Home Financials for this Owner
Home Financials are based on the most recent Mortgage that was taken out on this home.
Original Mortgage
$50,000
Outstanding Balance
$31,648
Interest Rate
6.3%
Mortgage Type
Future Advance Clause Open End Mortgage
Estimated Equity
$108,557
Purchase Details
Closed on
Apr 11, 2000
Sold by
County Of Benton
Bought by
Neustel Abbott Tracie and Abbott Matthew
Create a Home Valuation Report for This Property
The Home Valuation Report is an in-depth analysis detailing your home's value as well as a comparison with similar homes in the area
Home Values in the Area
Average Home Value in this Area
Purchase History
| Date | Buyer | Sale Price | Title Company |
|---|---|---|---|
| Rouse Roger | $25,000 | None Available | |
| Neustel Abbott Tracie | $1,007 | None Available |
Source: Public Records
Mortgage History
| Date | Status | Borrower | Loan Amount |
|---|---|---|---|
| Open | Rouse Roger | $50,000 |
Source: Public Records
Tax History Compared to Growth
Tax History
| Year | Tax Paid | Tax Assessment Tax Assessment Total Assessment is a certain percentage of the fair market value that is determined by local assessors to be the total taxable value of land and additions on the property. | Land | Improvement |
|---|---|---|---|---|
| 2025 | $1,398 | $107,800 | $14,600 | $93,200 |
| 2024 | $1,398 | $98,500 | $14,000 | $84,500 |
| 2023 | $1,732 | $98,500 | $14,000 | $84,500 |
| 2022 | $1,778 | $80,500 | $11,200 | $69,300 |
| 2021 | $1,778 | $80,500 | $11,200 | $69,300 |
| 2020 | $1,954 | $90,300 | $12,400 | $77,900 |
| 2019 | $1,936 | $90,300 | $12,400 | $77,900 |
| 2018 | $906 | $88,300 | $12,000 | $76,300 |
| 2017 | $656 | $42,500 | $12,000 | $30,500 |
| 2016 | $646 | $29,900 | $11,200 | $18,700 |
| 2015 | $646 | $29,900 | $11,200 | $18,700 |
| 2014 | $442 | $29,100 | $0 | $0 |
Source: Public Records
Map
Nearby Homes