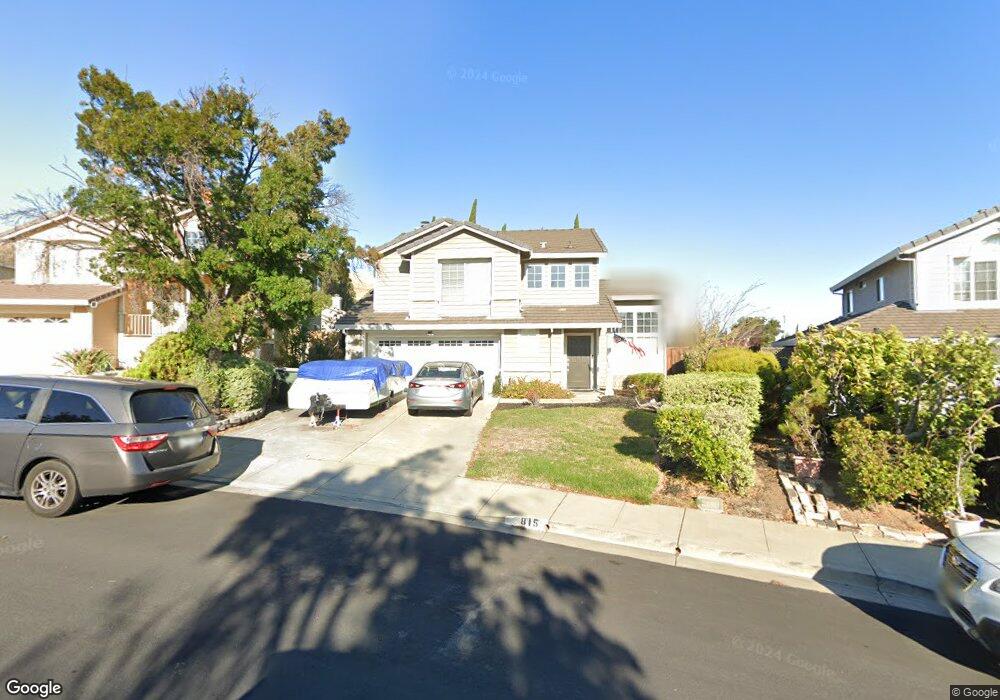
815 Dodd Ct Bay Point, CA 94565
Estimated Value: $615,771 - $725,000
3
Beds
3
Baths
1,426
Sq Ft
$460/Sq Ft
Est. Value
About This Home
This home is located at 815 Dodd Ct, Bay Point, CA 94565 and is currently estimated at $655,443, approximately $459 per square foot. 815 Dodd Ct is a home located in Contra Costa County with nearby schools including Shore Acres Elementary School, Riverview Middle School, and Mt. Diablo High School.
Ownership History
Date
Name
Owned For
Owner Type
Purchase Details
Closed on
Nov 23, 2020
Sold by
Burns Michelle Lynn and Bright Michelle Lynn
Bought by
Burns Michelle Lynn
Current Estimated Value
Home Financials for this Owner
Home Financials are based on the most recent Mortgage that was taken out on this home.
Original Mortgage
$270,000
Outstanding Balance
$240,262
Interest Rate
2.8%
Mortgage Type
New Conventional
Estimated Equity
$415,181
Purchase Details
Closed on
Sep 4, 2003
Sold by
Ching Yik Cheung and Kwan Pui King Ching
Bought by
Bright Michelle Lynn
Home Financials for this Owner
Home Financials are based on the most recent Mortgage that was taken out on this home.
Original Mortgage
$298,400
Interest Rate
5.87%
Mortgage Type
Stand Alone First
Purchase Details
Closed on
Jan 5, 1994
Sold by
Kaufman & Broad Of Northern Ca Inc
Bought by
Ching Yik Cheung and Kwan Pui King Ching
Create a Home Valuation Report for This Property
The Home Valuation Report is an in-depth analysis detailing your home's value as well as a comparison with similar homes in the area
Home Values in the Area
Average Home Value in this Area
Purchase History
| Date | Buyer | Sale Price | Title Company |
|---|---|---|---|
| Burns Michelle Lynn | -- | Fidelity National Title | |
| Bright Michelle Lynn | $373,000 | Commonwealth Title | |
| Ching Yik Cheung | $168,500 | First American Title Guarant |
Source: Public Records
Mortgage History
| Date | Status | Borrower | Loan Amount |
|---|---|---|---|
| Open | Burns Michelle Lynn | $270,000 | |
| Previous Owner | Bright Michelle Lynn | $298,400 |
Source: Public Records
Tax History
| Year | Tax Paid | Tax Assessment Tax Assessment Total Assessment is a certain percentage of the fair market value that is determined by local assessors to be the total taxable value of land and additions on the property. | Land | Improvement |
|---|---|---|---|---|
| 2025 | $7,432 | $530,310 | $177,715 | $352,595 |
| 2024 | $7,103 | $519,913 | $174,231 | $345,682 |
| 2023 | $7,103 | $509,719 | $170,815 | $338,904 |
| 2022 | $7,036 | $499,725 | $167,466 | $332,259 |
| 2021 | $6,872 | $489,928 | $164,183 | $325,745 |
| 2019 | $6,716 | $475,398 | $159,314 | $316,084 |
| 2018 | $6,482 | $466,078 | $156,191 | $309,887 |
| 2017 | $6,065 | $436,500 | $146,279 | $290,221 |
| 2016 | $5,659 | $405,000 | $135,723 | $269,277 |
| 2015 | $5,187 | $361,000 | $120,978 | $240,022 |
| 2014 | $5,035 | $347,000 | $116,286 | $230,714 |
Source: Public Records
Map
Nearby Homes
- 470 Jill Ave
- 621 Bounty Dr
- 744 Treasure Dr
- 50 Driftwood Cir
- 26 Seaview Dr
- 39 Harbor Dr
- 92 Beach Dr
- 87 Bay Dr
- 2484 Vernal Dr
- 232 Shore Rd
- 215 San Bernardino Ct
- 43 Bay Dr
- 94 Anchor Dr
- 149 Shore Rd
- 55 Pacifica Ave Unit 49
- 55 Pacifica Ave Unit 77
- 55 Pacifica Ave Unit 90
- 55 Pacifica Ave Unit 146
- 3777 Willow Pass Rd Unit 85
- 3777 Willow Pass Rd Unit 20