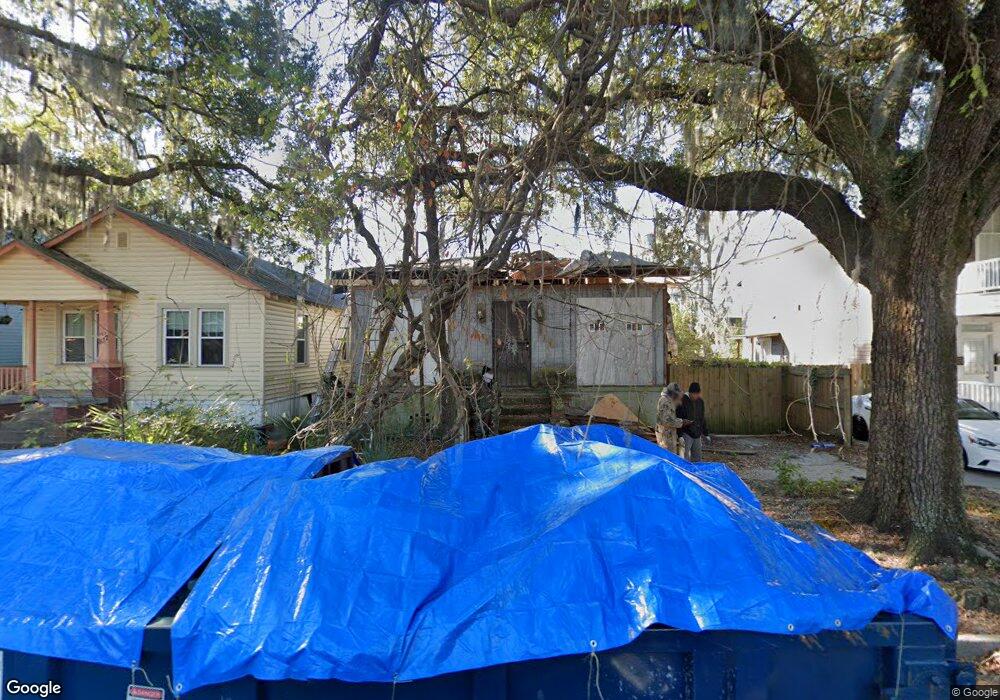
815 E 37th St Savannah, GA 31401
Midtown Savannah NeighborhoodEstimated Value: $146,000 - $434,000
2
Beds
1
Bath
1,176
Sq Ft
$254/Sq Ft
Est. Value
About This Home
This home is located at 815 E 37th St, Savannah, GA 31401 and is currently estimated at $298,333, approximately $253 per square foot. 815 E 37th St is a home located in Chatham County with nearby schools including Shuman Elementary School, Hubert Middle School, and Savannah Arts Academy.
Ownership History
Date
Name
Owned For
Owner Type
Purchase Details
Closed on
May 25, 2011
Sold by
Hines Frank
Bought by
West Travis E and West Annie Bell
Current Estimated Value
Purchase Details
Closed on
Apr 5, 2011
Sold by
Chatham County Tax Commiss
Bought by
Hines Frank
Create a Home Valuation Report for This Property
The Home Valuation Report is an in-depth analysis detailing your home's value as well as a comparison with similar homes in the area
Home Values in the Area
Average Home Value in this Area
Purchase History
| Date | Buyer | Sale Price | Title Company |
|---|---|---|---|
| West Travis E | -- | -- | |
| Hines Frank | -- | -- |
Source: Public Records
Tax History Compared to Growth
Tax History
| Year | Tax Paid | Tax Assessment Tax Assessment Total Assessment is a certain percentage of the fair market value that is determined by local assessors to be the total taxable value of land and additions on the property. | Land | Improvement |
|---|---|---|---|---|
| 2025 | $1,627 | $28,000 | $28,000 | $0 |
| 2024 | $1,627 | $28,000 | $28,000 | $0 |
| 2023 | $2,188 | $16,680 | $15,000 | $1,680 |
| 2022 | $1,933 | $22,640 | $15,000 | $7,640 |
| 2021 | $375 | $12,400 | $6,000 | $6,400 |
| 2020 | $547 | $17,320 | $6,000 | $11,320 |
| 2019 | $1,006 | $17,320 | $6,000 | $11,320 |
| 2018 | $549 | $14,960 | $6,000 | $8,960 |
| 2017 | $267 | $9,120 | $3,680 | $5,440 |
| 2016 | $250 | $8,560 | $3,680 | $4,880 |
| 2015 | $690 | $7,800 | $3,680 | $4,120 |
| 2014 | $392 | $7,040 | $0 | $0 |
Source: Public Records
Map
Nearby Homes