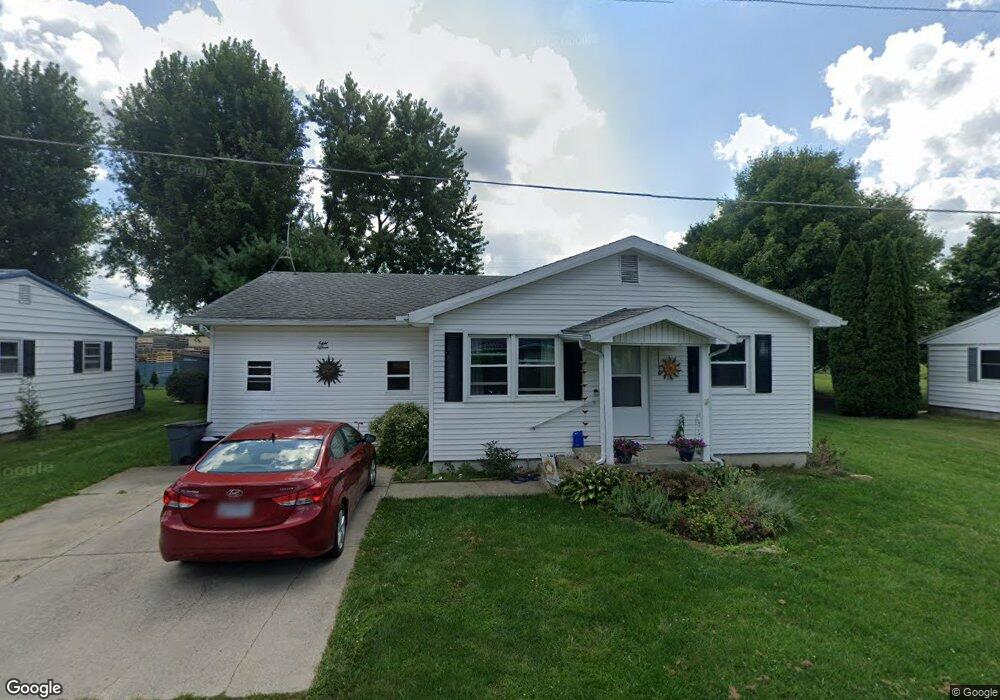
815 Kroger Dr Upper Sandusky, OH 43351
Estimated Value: $136,000 - $192,000
3
Beds
1
Bath
1,416
Sq Ft
$115/Sq Ft
Est. Value
About This Home
This home is located at 815 Kroger Dr, Upper Sandusky, OH 43351 and is currently estimated at $162,259, approximately $114 per square foot. 815 Kroger Dr is a home located in Wyandot County with nearby schools including Upper Sandusky High School and St. Peter Elementary School.
Ownership History
Date
Name
Owned For
Owner Type
Purchase Details
Closed on
Sep 4, 2020
Sold by
Collins Allen M
Bought by
Collins Allen M and Burka Amber N
Current Estimated Value
Home Financials for this Owner
Home Financials are based on the most recent Mortgage that was taken out on this home.
Original Mortgage
$92,424
Outstanding Balance
$81,802
Interest Rate
3%
Mortgage Type
New Conventional
Estimated Equity
$80,457
Purchase Details
Closed on
Nov 21, 2016
Home Financials for this Owner
Home Financials are based on the most recent Mortgage that was taken out on this home.
Interest Rate
3.94%
Purchase Details
Closed on
May 13, 2010
Sold by
Schmidt William F and Schmidt Janis I
Bought by
Heywood Donald and Heywood Tifani L Boltz
Home Financials for this Owner
Home Financials are based on the most recent Mortgage that was taken out on this home.
Original Mortgage
$54,160
Interest Rate
5.14%
Create a Home Valuation Report for This Property
The Home Valuation Report is an in-depth analysis detailing your home's value as well as a comparison with similar homes in the area
Home Values in the Area
Average Home Value in this Area
Purchase History
We collect this data history from publicly available records. To have your information removed, we recommend requesting removal directly through your county’s website.
| Date | Buyer | Sale Price | Title Company |
|---|---|---|---|
| Collins Allen M | -- | None Available | |
| Collins Allen M | $91,500 | None Available | |
| -- | -- | -- | |
| Heywood Donald | $67,700 | None Available |
Source: Public Records
Mortgage History
We collect this data history from publicly available records. To have your information removed, we recommend requesting removal directly through your county’s website.
| Date | Status | Borrower | Loan Amount |
|---|---|---|---|
| Open | Collins Allen M | $92,424 | |
| Previous Owner | -- | -- | |
| Previous Owner | Heywood Donald | $54,160 |
Source: Public Records
Tax History
| Year | Tax Paid | Tax Assessment Tax Assessment Total Assessment is a certain percentage of the fair market value that is determined by local assessors to be the total taxable value of land and additions on the property. | Land | Improvement |
|---|---|---|---|---|
| 2025 | $1,339 | $44,510 | $4,480 | $40,030 |
| 2024 | $1,062 | $33,380 | $3,800 | $29,580 |
| 2023 | $1,062 | $33,380 | $3,800 | $29,580 |
| 2022 | $1,062 | $25,930 | $3,090 | $22,840 |
| 2021 | $864 | $25,930 | $3,090 | $22,840 |
| 2020 | $864 | $25,930 | $3,090 | $22,840 |
| 2019 | $862 | $25,930 | $3,090 | $22,840 |
| 2018 | $732 | $22,420 | $3,640 | $18,780 |
| 2017 | $743 | $22,420 | $3,640 | $18,780 |
| 2016 | -- | $22,420 | $3,640 | $18,780 |
| 2015 | -- | $21,720 | $3,640 | $18,080 |
| 2014 | -- | $21,720 | $3,640 | $18,080 |
| 2013 | -- | $21,720 | $3,640 | $18,080 |
Source: Public Records
Map
Nearby Homes
- 600 Sunset Dr
- 575 Sunset Dr
- 386 W Finley St
- 512 N 7th St
- 505 N 8th St
- 212 N Hazel St
- 131 N Hazel St
- 344 W Walker St
- 9768 County Highway 111
- 137 N 8th St
- 479 N 5th St
- 431 W Johnson St
- 134 S 8th St
- 116 E Walker St
- 128 N 4th St
- 326 S 8th St
- 120, 140 & 160 Karcher Dr Unit 120, 140 & 160
- 432 E Bigelow St
- 123 E Johnson St
- 387 S Warpole St
- 811 Kroger Dr
- 817 Kroger Dr
- 0 Betty Lou St Lot #7
- 801 Kroger Dr
- 814 Kroger Dr
- 816 Kroger Dr
- 502 Baker Ct
- 0 Betty Lou St (Lot 7)
- 512 Baker Ct
- 525 Betty Lou St
- 735 Kroger Dr
- 503 Baker Ct
- 525 Kroger Dr
- 0 Baker Ct Unit H116660
- 0 Baker Ct Unit H135148
- 0 Baker Ct Unit H136220
- 535 Betty Lou St
- 533 Baker Ct
- 513 Baker Ct
- 522 Baker Ct
Your Personal Tour Guide
Ask me questions while you tour the home.