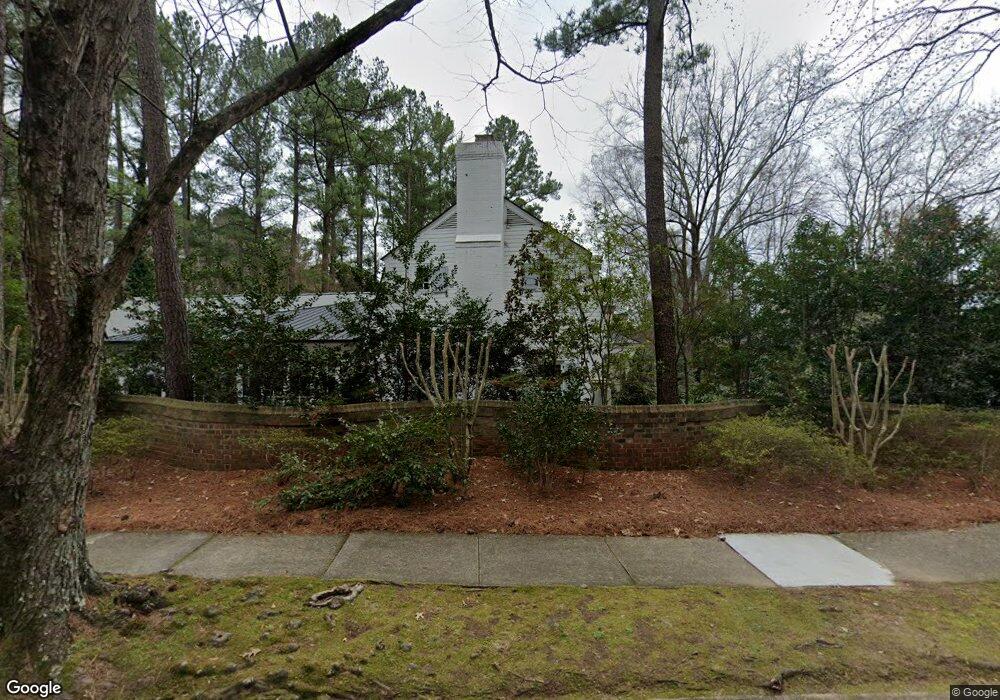
815 Marlowe Rd Unit 6 Raleigh, NC 27609
Glenwood NeighborhoodEstimated Value: $1,617,701 - $2,034,000
3
Beds
3
Baths
3,572
Sq Ft
$508/Sq Ft
Est. Value
About This Home
This home is located at 815 Marlowe Rd Unit 6, Raleigh, NC 27609 and is currently estimated at $1,816,175, approximately $508 per square foot. 815 Marlowe Rd Unit 6 is a home located in Wake County with nearby schools including Root Elementary School, Oberlin Middle School, and Broughton Magnet High School.
Ownership History
Date
Name
Owned For
Owner Type
Purchase Details
Closed on
Feb 15, 2017
Sold by
Miller Ida Odom and Miller William Stacy
Bought by
Poole Sarah
Current Estimated Value
Purchase Details
Closed on
Nov 30, 2015
Sold by
Miller W Stacy and Miller Ida Odom
Bought by
Miller Ida Odom
Purchase Details
Closed on
May 21, 2013
Sold by
Stacymiler W
Bought by
Miller W Stacy
Purchase Details
Closed on
Dec 10, 1998
Sold by
Johnson Rosalie R and Poe Rosalie R
Bought by
Miller Faye L
Home Financials for this Owner
Home Financials are based on the most recent Mortgage that was taken out on this home.
Original Mortgage
$300,000
Interest Rate
6.84%
Create a Home Valuation Report for This Property
The Home Valuation Report is an in-depth analysis detailing your home's value as well as a comparison with similar homes in the area
Home Values in the Area
Average Home Value in this Area
Purchase History
| Date | Buyer | Sale Price | Title Company |
|---|---|---|---|
| Poole Sarah | $1,030,000 | None Available | |
| Miller Ida Odom | $1,050,000 | None Available | |
| Miller W Stacy | -- | None Available | |
| Miller Faye L | $520,000 | -- |
Source: Public Records
Mortgage History
| Date | Status | Borrower | Loan Amount |
|---|---|---|---|
| Previous Owner | Miller Faye L | $300,000 | |
| Closed | Miller Faye L | $220,000 |
Source: Public Records
Tax History Compared to Growth
Tax History
| Year | Tax Paid | Tax Assessment Tax Assessment Total Assessment is a certain percentage of the fair market value that is determined by local assessors to be the total taxable value of land and additions on the property. | Land | Improvement |
|---|---|---|---|---|
| 2025 | $12,055 | $1,379,969 | $800,000 | $579,969 |
| 2024 | $11,829 | $1,379,969 | $800,000 | $579,969 |
| 2023 | $11,892 | $1,089,165 | $480,000 | $609,165 |
| 2022 | $11,048 | $1,089,165 | $480,000 | $609,165 |
| 2021 | $10,618 | $1,089,165 | $480,000 | $609,165 |
| 2020 | $10,424 | $1,089,165 | $480,000 | $609,165 |
| 2019 | $11,932 | $1,027,844 | $375,000 | $652,844 |
| 2018 | $10,220 | $933,543 | $375,000 | $558,543 |
| 2017 | $9,732 | $933,543 | $375,000 | $558,543 |
| 2016 | $9,531 | $933,543 | $375,000 | $558,543 |
| 2015 | $7,388 | $711,555 | $296,400 | $415,155 |
| 2014 | $7,006 | $711,555 | $296,400 | $415,155 |
Source: Public Records
Map
Nearby Homes
- 815 Marlowe Rd Unit 10
- 3501 Chaucer Place
- 3209 Northampton St
- 3425 Williamsborough Ct
- 512 Hertford St
- 516 Transylvania Ave
- 3409 White Oak Rd
- 501 Hertford St
- 3312 Alleghany Dr
- 401 Marlowe Rd
- 315 Allister Dr
- 3509 Turnbridge Dr
- 230 Penley Cir
- 221 Penley Cir
- 2724 Riddick Dr
- 340 Allister Dr Unit 201
- 340 Allister Dr Unit 105
- 220 Allister Dr
- 3525 Turnbridge Dr
- 3301 Dell Dr
- 815 Marlowe Rd Unit 7
- 815 Marlowe Rd Unit 8
- 815 Marlowe Rd Unit 9
- 815 Marlowe Rd Unit 11
- 815 Marlowe Rd Unit 12
- 815 Marlowe Rd Unit 1
- 815 Marlowe Rd Unit 2
- 815 Marlowe Rd Unit 3
- 815 Marlowe Rd Unit 4
- 815 Marlowe Rd Unit 5
- 815 Marlowe Rd
- 815-12 Marlowe Ct
- 809 Lassiter Place
- 801 Lassiter Place
- 833 Lassiter Place
- 813 Lassiter Place
- 805 Lassiter Place
- 3620 Old Lassiter Mill Rd
- 817 Lassiter Place
- 3505 Chaucer Place