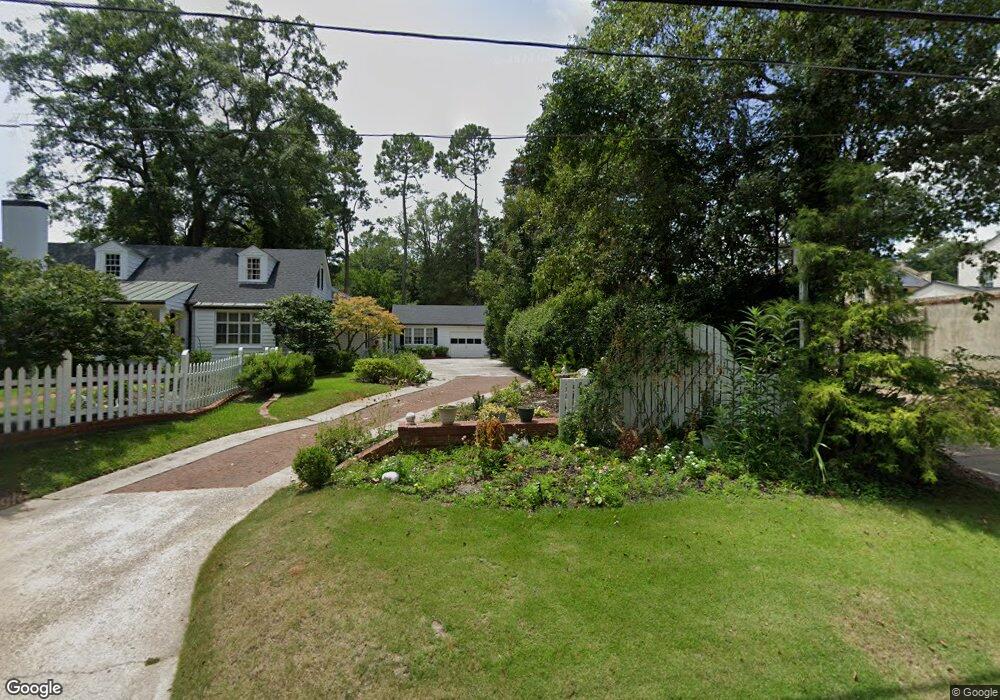
815 Milledge Rd Augusta, GA 30904
Summerville NeighborhoodEstimated Value: $994,000 - $1,566,000
4
Beds
6
Baths
5,030
Sq Ft
$252/Sq Ft
Est. Value
About This Home
This home is located at 815 Milledge Rd, Augusta, GA 30904 and is currently estimated at $1,266,411, approximately $251 per square foot. 815 Milledge Rd is a home located in Richmond County with nearby schools including R.B. Hunt Elementary School, Lake Forest Hills Elementary School, and Langford Middle School.
Ownership History
Date
Name
Owned For
Owner Type
Purchase Details
Closed on
Aug 1, 2025
Sold by
Meybohm E G
Bought by
Polatty Michael
Current Estimated Value
Purchase Details
Closed on
Dec 6, 2010
Sold by
Hooks Carolyn B
Bought by
Meybohm E G and Meybohm Lynn S
Purchase Details
Closed on
Apr 24, 2006
Sold by
Edenfield Larry and Edenfield Bonnie
Bought by
Edenfield Tract Llc
Purchase Details
Closed on
Jan 3, 1997
Sold by
Hooks Vendie Hudson Iii Hooks Caroly
Bought by
Meybohm E G Meybohm Lynn S
Purchase Details
Closed on
Jan 2, 1997
Sold by
Hooks Vendie Hudson
Bought by
Meybohm E G
Purchase Details
Closed on
Apr 30, 1991
Sold by
Wheeler Barry S
Bought by
Hooks Vendie Hudson Iiinhooks Carol
Purchase Details
Closed on
Oct 20, 1988
Sold by
Wheeler Barry S Bank Of Columbia County
Bought by
Hooks Vendie Hudson Iii Hooks Carol
Purchase Details
Closed on
Oct 1, 1988
Sold by
Wheeler Barry S
Bought by
Hooks Vendie Hudson
Purchase Details
Closed on
May 1, 1988
Sold by
Howard Marjorie B B
Bought by
Wheeler Barry S
Create a Home Valuation Report for This Property
The Home Valuation Report is an in-depth analysis detailing your home's value as well as a comparison with similar homes in the area
Home Values in the Area
Average Home Value in this Area
Purchase History
| Date | Buyer | Sale Price | Title Company |
|---|---|---|---|
| Polatty Michael | -- | -- | |
| Meybohm E G | -- | -- | |
| Edenfield Tract Llc | $200,500 | None Available | |
| Meybohm E G Meybohm Lynn S | -- | -- | |
| Meybohm E G | $190,000 | -- | |
| Hooks Vendie Hudson Iiinhooks Carol | -- | -- | |
| Hooks Vendie Hudson Iii Hooks Carol | -- | -- | |
| Hooks Vendie Hudson Iii Hooks Carol | $50,000 | -- | |
| Hooks Vendie Hudson | $50,000 | -- | |
| Wheeler Barry S | $225,000 | -- |
Source: Public Records
Tax History Compared to Growth
Tax History
| Year | Tax Paid | Tax Assessment Tax Assessment Total Assessment is a certain percentage of the fair market value that is determined by local assessors to be the total taxable value of land and additions on the property. | Land | Improvement |
|---|---|---|---|---|
| 2025 | $5,337 | $491,444 | $56,624 | $434,820 |
| 2024 | $5,337 | $440,020 | $56,624 | $383,396 |
| 2023 | $4,896 | $513,732 | $56,624 | $457,108 |
| 2022 | $5,176 | $381,275 | $56,624 | $324,651 |
| 2021 | $5,373 | $354,942 | $56,624 | $298,318 |
| 2020 | $5,181 | $338,354 | $61,847 | $276,507 |
| 2019 | $5,515 | $338,354 | $61,847 | $276,507 |
| 2018 | $5,566 | $338,354 | $61,847 | $276,507 |
| 2017 | $5,574 | $338,354 | $61,847 | $276,507 |
| 2016 | $5,574 | $338,354 | $61,847 | $276,507 |
| 2015 | $5,571 | $338,354 | $61,847 | $276,507 |
| 2014 | $5,568 | $338,354 | $61,847 | $276,507 |
Source: Public Records
Map
Nearby Homes
- 2213 Clayton Ln
- 2211 Clayton Ln
- 2204 Gardner St
- 2207 Clayton Ln
- 2203 Clayton Ln
- 2201 Clayton Ln
- 2110 Carnes Place
- 946 Milledge Rd
- 705 Hickman Rd
- 732 Katherine St
- 2232 Mcdowell St
- 729 Heard Ave
- 844 Heard Ave
- 1010 Hickman Rd Unit B5
- 1010 Hickman Rd Unit B3
- 1010 Hickman Rd Unit A2
- 803 Russell St
- 930 Heard Ave
- 1 Ivanhoe Ct
- 823 Milledge Rd
- 819 Milledge Rd
- 2240 Cumming Rd
- 807 Milledge Rd
- 2218 1/2 Cumming Rd
- 2216 Cumming Rd
- 827 Milledge Rd Unit B2
- 827 Milledge Rd Unit 1
- 827 Milledge Rd Unit F9
- 827 Milledge Rd Unit F8
- 827 Milledge Rd
- 827 Milledge Rd
- 827 Milledge Rd
- 827 Milledge Rd Unit F1
- 827 Milledge Rd
- 827 Milledge Rd
- 827 Milledge Rd Unit F6
- 827 Milledge Rd
- 827 Milledge Rd