815 S Catalina Ave Unit Top Redondo Beach, CA 90277
Estimated Value: $2,534,000 - $3,710,000
2
Beds
2
Baths
3,271
Sq Ft
$991/Sq Ft
Est. Value
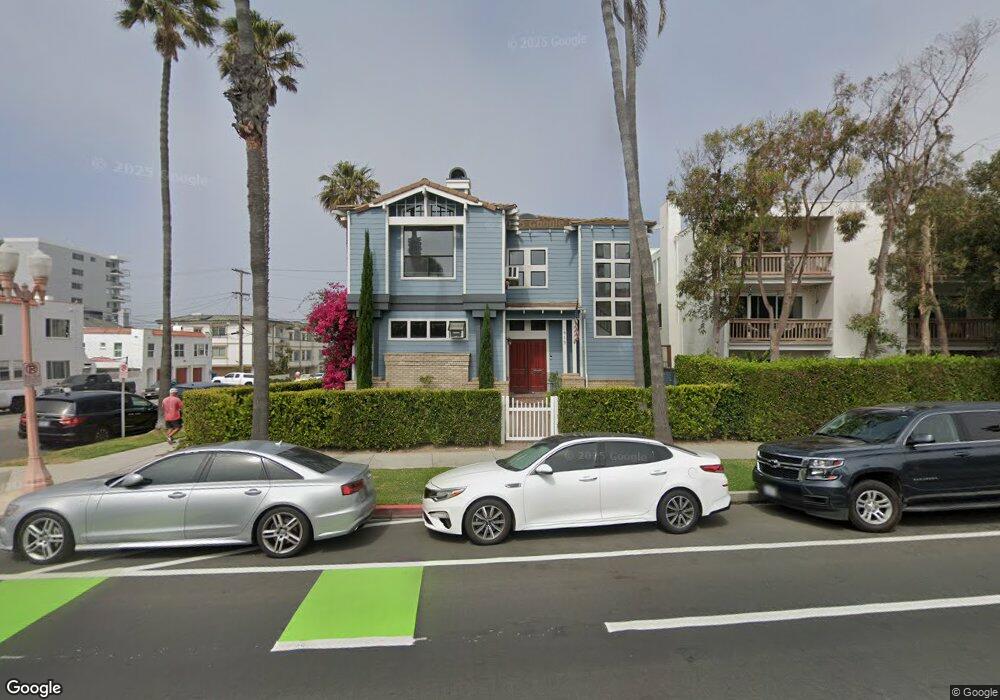
About This Home
This home is located at 815 S Catalina Ave Unit Top, Redondo Beach, CA 90277 and is currently estimated at $3,242,826, approximately $991 per square foot. 815 S Catalina Ave Unit Top is a home located in Los Angeles County with nearby schools including Alta Vista Elementary School, Parras (Nick G.) Middle School, and Redondo Union High School.
Ownership History
Date
Name
Owned For
Owner Type
Purchase Details
Closed on
Jul 7, 2014
Sold by
Maechling Jeanne H
Bought by
Maechling James E
Current Estimated Value
Home Financials for this Owner
Home Financials are based on the most recent Mortgage that was taken out on this home.
Original Mortgage
$1,170,000
Interest Rate
3.45%
Mortgage Type
Adjustable Rate Mortgage/ARM
Purchase Details
Closed on
May 15, 2014
Sold by
Maechling John T and Maechling Deanna E
Bought by
Liang Lily and Lily Liang 1988 Living Trust
Home Financials for this Owner
Home Financials are based on the most recent Mortgage that was taken out on this home.
Original Mortgage
$1,170,000
Interest Rate
3.45%
Mortgage Type
Adjustable Rate Mortgage/ARM
Purchase Details
Closed on
Aug 29, 2006
Sold by
Maechling John T
Bought by
Maechling John T and Maechling Deanna E
Create a Home Valuation Report for This Property
The Home Valuation Report is an in-depth analysis detailing your home's value as well as a comparison with similar homes in the area
Home Values in the Area
Average Home Value in this Area
Purchase History
| Date | Buyer | Sale Price | Title Company |
|---|---|---|---|
| Maechling James E | -- | Progressive Title Co | |
| Liang Lily | $1,950,000 | Progressive Title Co | |
| Maechling John T | -- | None Available | |
| Maechling John T | -- | None Available |
Source: Public Records
Mortgage History
| Date | Status | Borrower | Loan Amount |
|---|---|---|---|
| Previous Owner | Liang Lily | $1,170,000 |
Source: Public Records
Tax History Compared to Growth
Tax History
| Year | Tax Paid | Tax Assessment Tax Assessment Total Assessment is a certain percentage of the fair market value that is determined by local assessors to be the total taxable value of land and additions on the property. | Land | Improvement |
|---|---|---|---|---|
| 2025 | $26,257 | $2,343,598 | $1,406,159 | $937,439 |
| 2024 | $26,257 | $2,297,646 | $1,378,588 | $919,058 |
| 2023 | $25,769 | $2,252,595 | $1,351,557 | $901,038 |
| 2022 | $25,380 | $2,208,427 | $1,325,056 | $883,371 |
| 2021 | $24,794 | $2,165,125 | $1,299,075 | $866,050 |
| 2019 | $24,270 | $2,100,908 | $1,260,545 | $840,363 |
| 2018 | $23,676 | $2,059,715 | $1,235,829 | $823,886 |
| 2016 | $22,937 | $1,979,737 | $1,187,842 | $791,895 |
| 2015 | $22,514 | $1,950,000 | $1,170,000 | $780,000 |
| 2014 | $7,299 | $579,978 | $118,151 | $461,827 |
Source: Public Records
Map
Nearby Homes
- 1007 S Catalina Ave Unit 106
- 1007 S Catalina Ave Unit 109
- 724 S Broadway Unit B
- 716 S Broadway Unit A
- 520 Avenue B Unit 7
- 641 S Gertruda Ave
- 1205 S Catalina Ave Unit A
- 625 Esplanade Unit 29
- 625 Esplanade Unit 4
- 626 Elvira Ave
- 620 S Catalina Ave Unit C
- 615 Esplanade Unit 508
- 615 Esplanade Unit 512
- 304 Avenue E
- 575 Esplanade Unit 102
- 515 S Broadway Unit B
- 510 S Catalina Ave Unit 2
- 512 Esplanade Unit 303
- 1505 S Catalina Ave
- 555 Esplanade Unit 520
- 815 S Catalina Ave Unit 2
- 815 S Catalina Ave Unit B
- 815 S Catalina Ave Unit A
- 815 S Catalina Ave
- 813 S Catalina Ave
- 105 Avenue A
- 104 Avenue A
- 104 Avenue A Unit Upper Back Unit
- 903 S Catalina Ave
- 816 Esplanade Unit 4
- 816 Esplanade Unit 3
- 816 Esplanade Unit 2
- 816 Esplanade Unit 1
- 816 Esplanade
- 816 Esplanade Unit F
- 816 Esplanade Unit 5
- 816 Esplanade Unit D
- 816 Esplanade Unit C
- 816 Esplanade Unit B
- 816 Esplanade Unit A