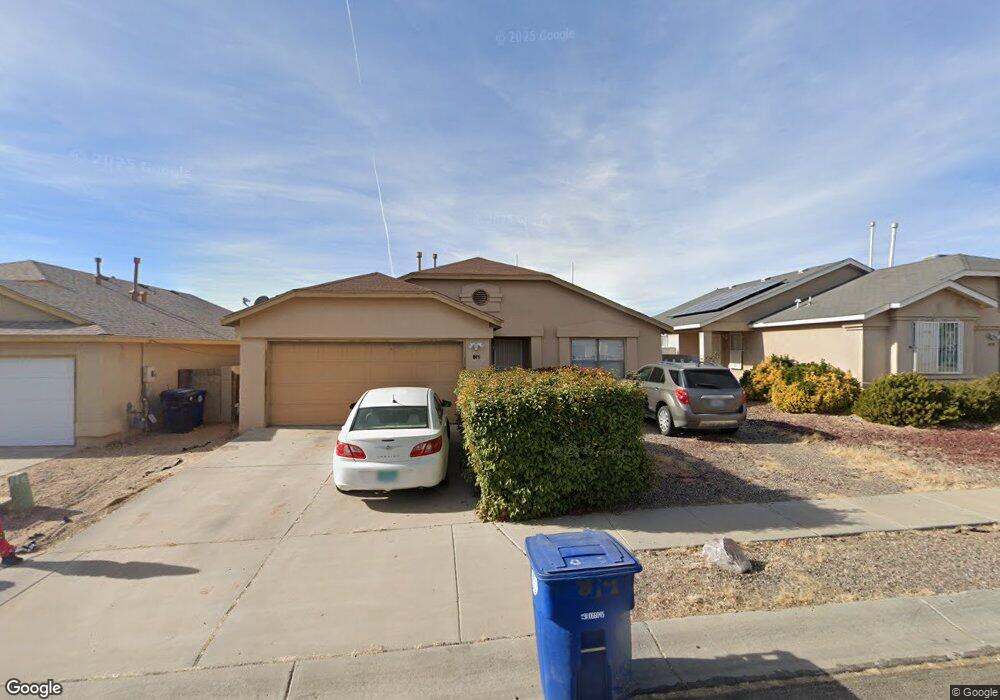
815 Shire St SW Unit 1 Albuquerque, NM 87121
Southwest Heights NeighborhoodEstimated Value: $264,000 - $305,000
3
Beds
2
Baths
1,344
Sq Ft
$210/Sq Ft
Est. Value
About This Home
This home is located at 815 Shire St SW Unit 1, Albuquerque, NM 87121 and is currently estimated at $282,678, approximately $210 per square foot. 815 Shire St SW Unit 1 is a home located in Bernalillo County with nearby schools including Carlos Rey Elementary School, Jimmy Carter Middle School, and West Mesa High School.
Ownership History
Date
Name
Owned For
Owner Type
Purchase Details
Closed on
Oct 3, 2008
Sold by
Archuleta Alfonso R
Bought by
Guillen Aurelia and Guillen Sylvia Lorena
Current Estimated Value
Home Financials for this Owner
Home Financials are based on the most recent Mortgage that was taken out on this home.
Original Mortgage
$131,900
Interest Rate
6.62%
Mortgage Type
Seller Take Back
Purchase Details
Closed on
Sep 19, 2006
Sold by
Chavez Daniel
Bought by
Archuleta Alfonso R
Home Financials for this Owner
Home Financials are based on the most recent Mortgage that was taken out on this home.
Original Mortgage
$139,900
Interest Rate
8.5%
Mortgage Type
Seller Take Back
Purchase Details
Closed on
Jul 25, 2006
Sold by
Provencio Loretta
Bought by
Archuleta Alfonso
Home Financials for this Owner
Home Financials are based on the most recent Mortgage that was taken out on this home.
Original Mortgage
$139,900
Interest Rate
8.5%
Mortgage Type
Seller Take Back
Create a Home Valuation Report for This Property
The Home Valuation Report is an in-depth analysis detailing your home's value as well as a comparison with similar homes in the area
Home Values in the Area
Average Home Value in this Area
Purchase History
| Date | Buyer | Sale Price | Title Company |
|---|---|---|---|
| Guillen Aurelia | $139,900 | None Available | |
| Archuleta Alfonso R | -- | None Available | |
| Chavez Daniel | $149,900 | None Available | |
| Archuleta Alfonso | -- | Fntc | |
| Archuleta Alfonso | $128,000 | None Available |
Source: Public Records
Mortgage History
| Date | Status | Borrower | Loan Amount |
|---|---|---|---|
| Closed | Guillen Aurelia | $131,900 | |
| Previous Owner | Chavez Daniel | $139,900 | |
| Previous Owner | Archuleta Alfonso | $114,500 |
Source: Public Records
Tax History Compared to Growth
Tax History
| Year | Tax Paid | Tax Assessment Tax Assessment Total Assessment is a certain percentage of the fair market value that is determined by local assessors to be the total taxable value of land and additions on the property. | Land | Improvement |
|---|---|---|---|---|
| 2024 | $1,778 | $42,137 | $12,045 | $30,092 |
| 2023 | $1,748 | $40,910 | $11,694 | $29,216 |
| 2022 | $1,689 | $39,719 | $11,354 | $28,365 |
| 2021 | $1,633 | $38,562 | $11,023 | $27,539 |
| 2020 | $1,606 | $37,439 | $10,702 | $26,737 |
| 2019 | $1,559 | $36,350 | $10,391 | $25,959 |
| 2018 | $1,503 | $36,350 | $10,391 | $25,959 |
| 2017 | $1,457 | $35,291 | $10,088 | $25,203 |
| 2016 | $1,415 | $33,265 | $9,509 | $23,756 |
| 2015 | $32,296 | $32,296 | $9,232 | $23,064 |
| 2014 | $1,381 | $32,530 | $9,232 | $23,298 |
| 2013 | -- | $32,530 | $9,232 | $23,298 |
Source: Public Records
Map
Nearby Homes
- 11001 Paso Fino Ave SW
- 11004 Teal Rd SW
- 919 Crane Dr SW
- 10504 Connemara Dr SW
- 1111 Carla St SW
- 10409 Red Robin Rd SW
- 10316 Andalusian Ave SW
- 10350 Sunset Gardens Rd SW
- 10216 Teal Rd SW
- 1309 Canyon Trail SW
- 10312 Cornelia Ct SW
- 805 Malachite Dr SW
- 632 Foyt Dr SW
- 1401 Elfego Baca Dr SW
- 10709 Anaya St SW
- 10622 Benavides Rd SW
- 1520 Elfego Baca Dr SW Unit 2
- 9931 Hideout Ln SW
- 9900 Ladder Ranch Ln SW
- 9915 King Ranch Ln SW
- 815 Shire St SW
- 819 Shire St SW
- 809 Shire St SW
- 823 Shire St SW
- 805 Shire St SW
- 827 Shire St SW
- 816 Shire St SW
- 812 Shire St SW
- 820 Shire St SW
- 801 Shire St SW
- 808 Shire St SW
- 824 Shire St SW
- 831 Shire St SW
- 804 Shire St SW
- 804 Shire St SW Unit SW
- 828 Shire St SW
- 835 Shire St SW
- 800 Shire St SW
- 832 Shire St SW
- 735 Shire St SW