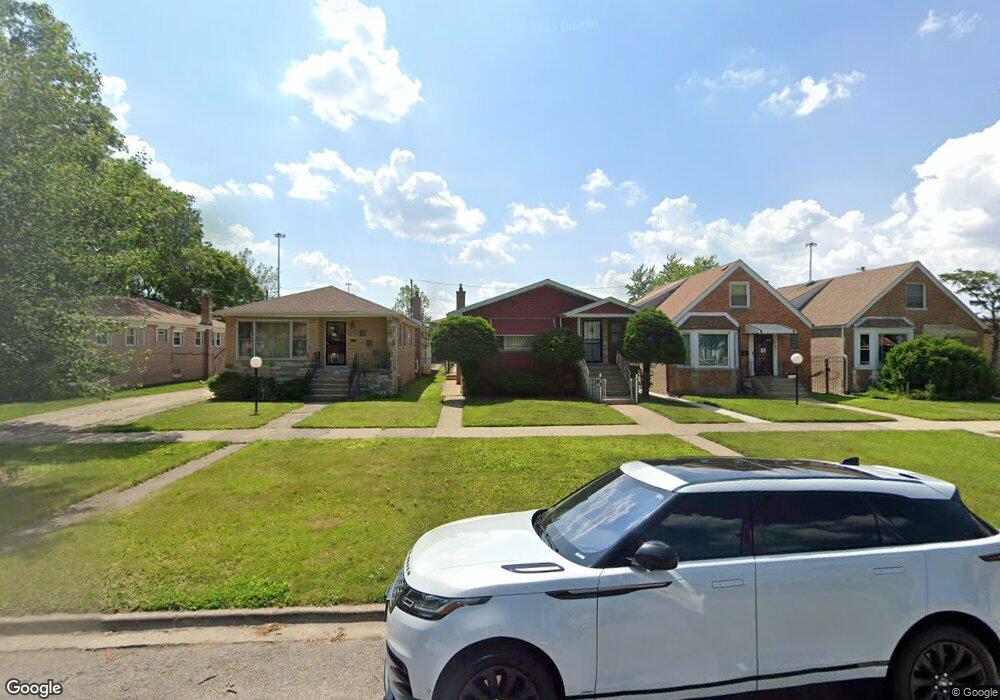
8150 S Wabash Ave Chicago, IL 60619
Chatham NeighborhoodEstimated Value: $199,000 - $260,000
3
Beds
2
Baths
1,456
Sq Ft
$158/Sq Ft
Est. Value
About This Home
This home is located at 8150 S Wabash Ave, Chicago, IL 60619 and is currently estimated at $229,666, approximately $157 per square foot. 8150 S Wabash Ave is a home located in Cook County with nearby schools including Ruggles Elementary School and Rescue Missionary Christian School.
Ownership History
Date
Name
Owned For
Owner Type
Purchase Details
Closed on
Oct 30, 2009
Sold by
Yanders Elise Roby
Bought by
Roby Mabry T
Current Estimated Value
Home Financials for this Owner
Home Financials are based on the most recent Mortgage that was taken out on this home.
Original Mortgage
$176,739
Outstanding Balance
$115,698
Interest Rate
5.05%
Mortgage Type
FHA
Estimated Equity
$113,968
Create a Home Valuation Report for This Property
The Home Valuation Report is an in-depth analysis detailing your home's value as well as a comparison with similar homes in the area
Home Values in the Area
Average Home Value in this Area
Purchase History
| Date | Buyer | Sale Price | Title Company |
|---|---|---|---|
| Roby Mabry T | $180,000 | First American |
Source: Public Records
Mortgage History
| Date | Status | Borrower | Loan Amount |
|---|---|---|---|
| Open | Roby Mabry T | $176,739 |
Source: Public Records
Tax History Compared to Growth
Tax History
| Year | Tax Paid | Tax Assessment Tax Assessment Total Assessment is a certain percentage of the fair market value that is determined by local assessors to be the total taxable value of land and additions on the property. | Land | Improvement |
|---|---|---|---|---|
| 2024 | $4,065 | $13,542 | $4,208 | $9,334 |
| 2023 | $3,963 | $19,267 | $5,610 | $13,657 |
| 2022 | $3,963 | $19,267 | $5,610 | $13,657 |
| 2021 | $3,874 | $19,267 | $5,610 | $13,657 |
| 2020 | $2,681 | $12,033 | $4,488 | $7,545 |
| 2019 | $2,657 | $13,224 | $4,488 | $8,736 |
| 2018 | $2,612 | $13,224 | $4,488 | $8,736 |
| 2017 | $2,977 | $13,828 | $3,927 | $9,901 |
| 2016 | $2,770 | $13,828 | $3,927 | $9,901 |
| 2015 | $2,534 | $13,828 | $3,927 | $9,901 |
| 2014 | $2,680 | $14,444 | $3,366 | $11,078 |
| 2013 | $2,627 | $14,444 | $3,366 | $11,078 |
Source: Public Records
Map
Nearby Homes
- 7627 S State St
- 8243 S Wabash Ave
- 8008 S Wabash Ave
- 124 E 83rd St
- 8146 S Prairie Park Place
- 7950 S Lafayette Ave
- 8400 S Wabash Ave
- 8030 S Prairie Ave
- 7950 S Indiana Ave
- 8126 S Wentworth Ave
- 7940 S Perry Ave
- 8252 S Calumet Ave
- 8443 S State St
- 8043 S Yale Ave
- 8153 S Calumet Ave
- 8129 S Princeton Ave
- 8032 S King Dr
- 8343 S Calumet Ave
- 7811 S Wabash Ave
- 7918 S Calumet Ave
- 8146 S Wabash Ave
- 8154 S Wabash Ave
- 8142 S Wabash Ave
- 8158 S Wabash Ave
- 8138 S Wabash Ave
- 8130 S Wabash Ave
- 8149 S State St
- 8200 S Wabash Ave
- 8151 S State St
- 8151 S State St Unit 2
- 8155 S State St
- 8128 S Wabash Ave
- 8145 S State St
- 8141 S State St
- 8204 S Wabash Ave
- 8159 S State St
- 8135 S State St Unit 2
- 8139 S State St
- 8124 S Wabash Ave
- 8147 S Wabash Ave