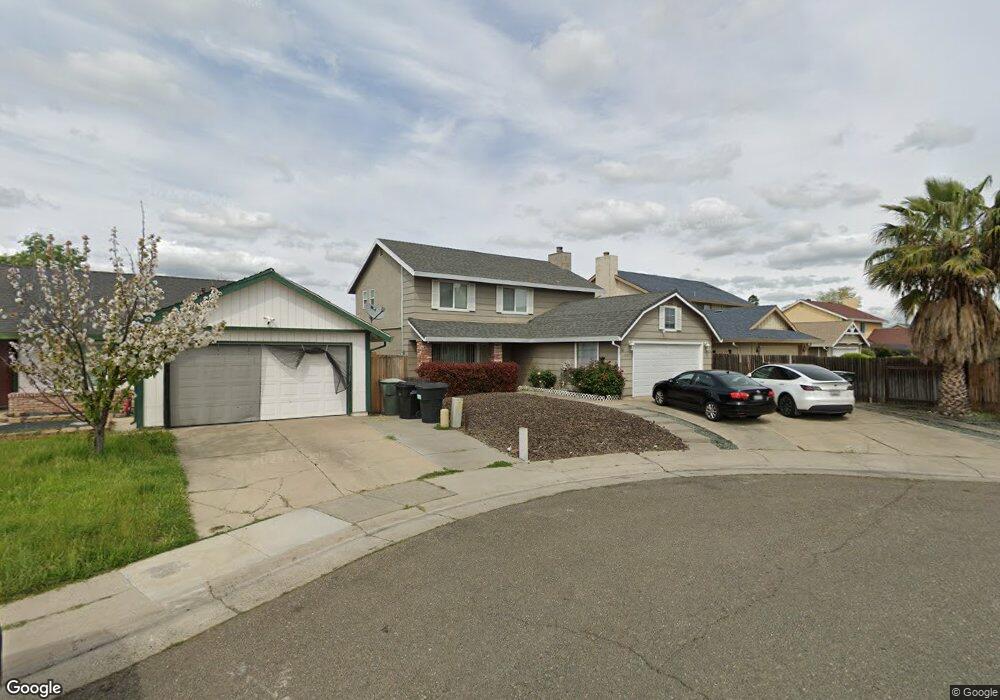
8151 Orange Cove Ct Sacramento, CA 95828
Estimated Value: $379,000 - $554,000
4
Beds
2
Baths
1,656
Sq Ft
$285/Sq Ft
Est. Value
About This Home
This home is located at 8151 Orange Cove Ct, Sacramento, CA 95828 and is currently estimated at $471,354, approximately $284 per square foot. 8151 Orange Cove Ct is a home located in Sacramento County with nearby schools including Isabelle Jackson Elementary School, James Rutter Middle School, and Florin High School.
Ownership History
Date
Name
Owned For
Owner Type
Purchase Details
Closed on
Jul 24, 2017
Sold by
He Guangyu and Zhang Yali
Bought by
He Yishuai and Li Han
Current Estimated Value
Purchase Details
Closed on
May 20, 2013
Sold by
He Guangyu
Bought by
Zhang Yali and He Guangyu
Purchase Details
Closed on
Oct 4, 2010
Sold by
Zhang Ya Li
Bought by
He Guang Yu
Purchase Details
Closed on
Oct 1, 2010
Sold by
Deutsche Bank Trust Company Americas
Bought by
He Guang Yu
Purchase Details
Closed on
Sep 4, 2010
Sold by
Tien Sharon
Bought by
Deutsche Bank Trust Company Americas
Purchase Details
Closed on
Jun 29, 2005
Sold by
Tien Sharon
Bought by
Tien Sharon
Home Financials for this Owner
Home Financials are based on the most recent Mortgage that was taken out on this home.
Original Mortgage
$250,500
Interest Rate
5.55%
Mortgage Type
Fannie Mae Freddie Mac
Create a Home Valuation Report for This Property
The Home Valuation Report is an in-depth analysis detailing your home's value as well as a comparison with similar homes in the area
Home Values in the Area
Average Home Value in this Area
Purchase History
| Date | Buyer | Sale Price | Title Company |
|---|---|---|---|
| He Yishuai | -- | None Available | |
| Zhang Yali | -- | None Available | |
| He Guang Yu | -- | Chicago Title Company | |
| He Guang Yu | $138,000 | Chicago Title Company | |
| Deutsche Bank Trust Company Americas | $128,000 | Accommodation | |
| Tien Sharon | -- | North American Title Co | |
| Tien Sharon | -- | North American Title Co |
Source: Public Records
Mortgage History
| Date | Status | Borrower | Loan Amount |
|---|---|---|---|
| Previous Owner | Tien Sharon | $250,500 |
Source: Public Records
Tax History Compared to Growth
Tax History
| Year | Tax Paid | Tax Assessment Tax Assessment Total Assessment is a certain percentage of the fair market value that is determined by local assessors to be the total taxable value of land and additions on the property. | Land | Improvement |
|---|---|---|---|---|
| 2025 | $2,024 | $176,788 | $44,833 | $131,955 |
| 2024 | $2,024 | $173,322 | $43,954 | $129,368 |
| 2023 | $1,976 | $169,925 | $43,093 | $126,832 |
| 2022 | $1,944 | $166,595 | $42,249 | $124,346 |
| 2021 | $1,924 | $163,329 | $41,421 | $121,908 |
| 2020 | $1,899 | $161,655 | $40,997 | $120,658 |
| 2019 | $1,867 | $158,487 | $40,194 | $118,293 |
| 2018 | $1,819 | $155,380 | $39,406 | $115,974 |
| 2017 | $1,790 | $152,334 | $38,634 | $113,700 |
| 2016 | $1,704 | $149,348 | $37,877 | $111,471 |
| 2015 | $1,674 | $147,106 | $37,309 | $109,797 |
| 2014 | $1,648 | $144,226 | $36,579 | $107,647 |
Source: Public Records
Map
Nearby Homes
- 8186 Gustine Way
- 8077 Goran Ct
- 8016 Stevenson Ave
- 7905 Springarden Way
- 7901 Stevenson Ave
- 8095 E Stockton Blvd
- 4.13 ACR Lenhart Rd
- 8336 Cutler Way
- 8346 Floxtree Ct
- 8266 Summer Sunset Dr
- 8317 Honeycomb Way
- 7711 Lenhart Rd
- 8282 Union Creek Way
- 0 Rangeview Ln
- 8012 Northern Oak Cir
- 8045 Arroyo Vista Dr
- 8336 Summer Sunset Dr
- 8437 Yermo Way
- 8205 Weyburn Ct
- 7715 Cotton Ln
- 8161 Pine Cove Ct
- 8147 Orange Cove Ct
- 8165 Pine Cove Ct
- 8143 Orange Cove Ct
- 8164 Cliffe Way
- 8160 Cliffe Way
- 8168 Cliffe Way
- 8139 Orange Cove Ct
- 8156 Cliffe Way
- 8150 Orange Cove Ct
- 8160 Pine Cove Ct
- 8146 Orange Cove Ct
- 8142 Orange Cove Ct
- 8152 Cliffe Way
- 8173 Pine Cove Ct
- 8166 Pine Cove Ct
- 8138 Orange Cove Ct
- 8170 Pine Cove Ct
- 8148 Cliffe Way