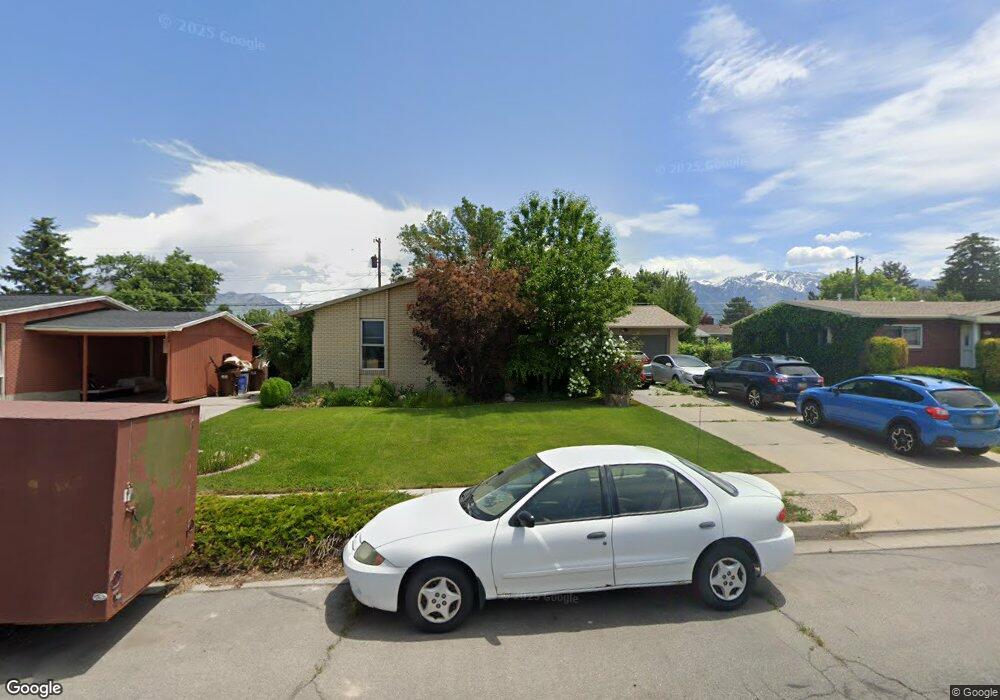
8157 S Coolidge St Midvale, UT 84047
Estimated Value: $626,000 - $694,000
3
Beds
4
Baths
1,432
Sq Ft
$455/Sq Ft
Est. Value
About This Home
This home is located at 8157 S Coolidge St, Midvale, UT 84047 and is currently estimated at $651,950, approximately $455 per square foot. 8157 S Coolidge St is a home located in Salt Lake County with nearby schools including Copperview Elementary School, Midvale Middle School, and Hillcrest High School.
Ownership History
Date
Name
Owned For
Owner Type
Purchase Details
Closed on
Sep 21, 2020
Sold by
Olson Jenny C and Olson David D
Bought by
Simpson Erik
Current Estimated Value
Home Financials for this Owner
Home Financials are based on the most recent Mortgage that was taken out on this home.
Original Mortgage
$432,250
Outstanding Balance
$383,593
Interest Rate
2.9%
Mortgage Type
New Conventional
Estimated Equity
$268,357
Purchase Details
Closed on
Aug 17, 2017
Sold by
Treehouse Investments Llc
Bought by
Olson Jenny C and Olson David D
Home Financials for this Owner
Home Financials are based on the most recent Mortgage that was taken out on this home.
Original Mortgage
$326,890
Interest Rate
3.96%
Mortgage Type
New Conventional
Purchase Details
Closed on
May 8, 2017
Sold by
Muller Peter L and Muller Abigail F
Bought by
Treehouse Investments Llc
Purchase Details
Closed on
Sep 28, 2012
Sold by
Muller Peter L and Muller Abigale F
Bought by
Muller Peter L and Muller Abigail F
Create a Home Valuation Report for This Property
The Home Valuation Report is an in-depth analysis detailing your home's value as well as a comparison with similar homes in the area
Home Values in the Area
Average Home Value in this Area
Purchase History
| Date | Buyer | Sale Price | Title Company |
|---|---|---|---|
| Simpson Erik | -- | Vanguard Title Union Park | |
| Olson Jenny C | -- | Richland Title Ins Agency In | |
| Treehouse Investments Llc | -- | Richland Title Ins Agency In | |
| Muller Peter L | -- | First American Title |
Source: Public Records
Mortgage History
| Date | Status | Borrower | Loan Amount |
|---|---|---|---|
| Open | Simpson Erik | $432,250 | |
| Previous Owner | Olson Jenny C | $326,890 |
Source: Public Records
Tax History
| Year | Tax Paid | Tax Assessment Tax Assessment Total Assessment is a certain percentage of the fair market value that is determined by local assessors to be the total taxable value of land and additions on the property. | Land | Improvement |
|---|---|---|---|---|
| 2025 | $3,347 | $603,000 | $127,800 | $475,200 |
| 2024 | $3,347 | $570,900 | $120,900 | $450,000 |
| 2023 | $3,232 | $547,500 | $114,900 | $432,600 |
| 2022 | $3,406 | $563,400 | $112,700 | $450,700 |
| 2021 | $3,159 | $448,400 | $103,300 | $345,100 |
| 2020 | $2,703 | $363,500 | $75,100 | $288,400 |
| 2019 | $2,477 | $325,200 | $70,400 | $254,800 |
| 2016 | $1,758 | $265,200 | $70,400 | $194,800 |
Source: Public Records
Map
Nearby Homes
- 8218 S Coolidge St
- 139 W Columbia Dr
- 36 Marquette Dr
- 7987 S Grant St
- 8343 Monroe St
- 74 E Resaca Dr Unit B12
- 36 E Opequon Rd
- 8229 S Resaca Dr Unit D3
- 90 E Resaca Dr Unit C11
- 311 Marquette Dr
- 8404 S Monroe St
- 332 W Harvard Dr
- 7865 S Grant St
- 117 E Calbourne Ln Unit I4
- 8408 S Foxbridge Cir
- 135 E Station St
- 8264 S Resaca Dr Unit K9
- 8278 S Resaca Dr Unit L-10
- 8278 S Resaca Dr Unit L1
- 396 Harvard Dr
- 8157 Coolidge St
- 8165 Coolidge St
- 8165 S Coolidge St
- 8145 S Coolidge St
- 8145 Coolidge St
- 8158 Wood St
- 8146 S Wood St
- 8146 Wood St
- 8173 Coolidge St
- 8133 Coolidge St Unit 8135
- 345 Coolidge St
- 8156 S Coolidge St
- 8156 Coolidge St
- 8166 Wood St
- 8164 Coolidge St
- 8136 Wood St
- 8144 Coolidge St
- 336 Coolidge St
- 8172 S Coolidge St
- 8172 Coolidge St
Your Personal Tour Guide
Ask me questions while you tour the home.