Estimated Value: $312,942 - $358,000
4
Beds
2
Baths
2,108
Sq Ft
$158/Sq Ft
Est. Value
About This Home
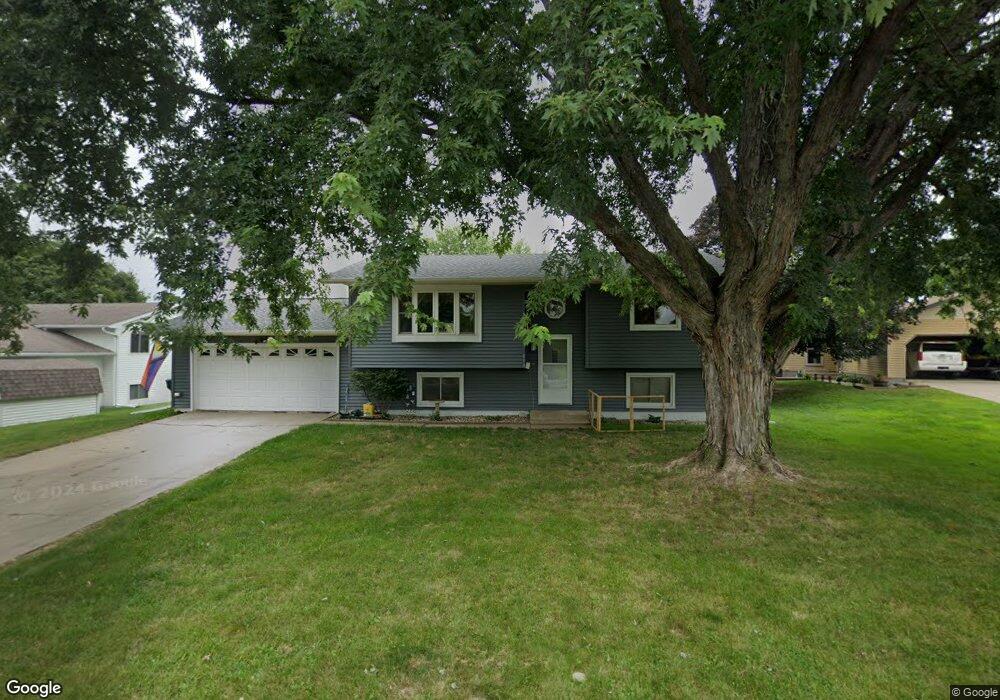
This home is located at 816 2nd Ave NE, Byron, MN 55920 and is currently estimated at $332,486, approximately $157 per square foot. 816 2nd Ave NE is a home located in Olmsted County with nearby schools including Byron Intermediate School, Byron Middle School, and Byron Senior High School.
Ownership History
Date
Name
Owned For
Owner Type
Purchase Details
Closed on
Oct 14, 2025
Sold by
Morris Bryan H
Bought by
Morris Sarah E
Current Estimated Value
Purchase Details
Closed on
Aug 11, 2011
Sold by
Maier Companies Inc
Bought by
Morris Bryan H and Morris Sarah E
Home Financials for this Owner
Home Financials are based on the most recent Mortgage that was taken out on this home.
Original Mortgage
$138,800
Interest Rate
4.59%
Mortgage Type
New Conventional
Purchase Details
Closed on
May 19, 2011
Sold by
Secretary Of Housing & Urban Development
Bought by
Meier Companies Inc
Purchase Details
Closed on
Jun 17, 2010
Sold by
Wells Fargo Bank Na
Bought by
Secretary Of Housing & Urban Development
Purchase Details
Closed on
Nov 20, 2009
Sold by
Pries Steven
Bought by
Wells Fargo Bank Na
Create a Home Valuation Report for This Property
The Home Valuation Report is an in-depth analysis detailing your home's value as well as a comparison with similar homes in the area
Home Values in the Area
Average Home Value in this Area
Purchase History
| Date | Buyer | Sale Price | Title Company |
|---|---|---|---|
| Morris Sarah E | $3,000 | Atypical Title | |
| Morris Bryan H | $143,100 | Rochester Title | |
| Meier Companies Inc | -- | Northwest Title Agency Inc | |
| Secretary Of Housing & Urban Development | -- | None Available | |
| Wells Fargo Bank Na | $159,840 | None Available |
Source: Public Records
Mortgage History
| Date | Status | Borrower | Loan Amount |
|---|---|---|---|
| Previous Owner | Morris Bryan H | $138,800 |
Source: Public Records
Tax History Compared to Growth
Tax History
| Year | Tax Paid | Tax Assessment Tax Assessment Total Assessment is a certain percentage of the fair market value that is determined by local assessors to be the total taxable value of land and additions on the property. | Land | Improvement |
|---|---|---|---|---|
| 2024 | $4,402 | $272,200 | $45,000 | $227,200 |
| 2023 | $4,110 | $260,000 | $40,000 | $220,000 |
| 2022 | $3,938 | $247,200 | $40,000 | $207,200 |
| 2021 | $3,458 | $214,700 | $40,000 | $174,700 |
| 2020 | $3,244 | $200,800 | $40,000 | $160,800 |
| 2019 | $3,052 | $183,400 | $30,000 | $153,400 |
| 2018 | $2,734 | $172,900 | $30,000 | $142,900 |
| 2017 | $2,604 | $159,400 | $30,000 | $129,400 |
| 2016 | $2,440 | $148,000 | $18,600 | $129,400 |
| 2015 | $2,378 | $135,400 | $18,600 | $116,800 |
| 2014 | $2,216 | $136,800 | $18,600 | $118,200 |
| 2012 | -- | $137,500 | $18,600 | $118,900 |
Source: Public Records
Map
Nearby Homes
- 910 Byron Ave N
- 925 Byron Ave N
- 1005 4th Ave NE
- 655 Somerby Pkwy NE
- 667 Somerby Pkwy NE
- 498 Somerby Pkwy NE
- 516 Somerby Pkwy NE
- 843 Somerby Pkwy NE
- 827 Somerby Pkwy NE
- 805 Somerby Pkwy NE
- 675 Somerby Pkwy NE
- 264 Somerby Pkwy NE
- 244 Somerby Pkwy NE
- 226 Somerby Pkwy NE
- 208 Somerby Pkwy NE
- 190 Somerby Pkwy NE
- 172 Somerby Pkwy NE
- 355 Somerby Pkwy NE
- 337 Somerby Pkwy NE
- 154 Somerby Pkwy NE
- 816 816 2nd-Avenue-ne
- 820 2nd Ave NE
- 812 2nd Ave NE
- 204 9th St NE
- 808 2nd Ave NE
- 208 9th St NE
- 817 2nd Ave NE
- 129 8th St NE
- 125 8th St NE
- 125 125 8th-Street-ne
- 821 2nd Ave NE
- 813 813 2nd-Avenue-ne
- 201 8th St NE
- 813 2nd Ave NE
- 201 201 8th-Street-ne
- 804 2nd Ave NE
- 205 9th St NE
- 209 9th St NE
- 201 9th St NE
- 809 2nd Ave NE