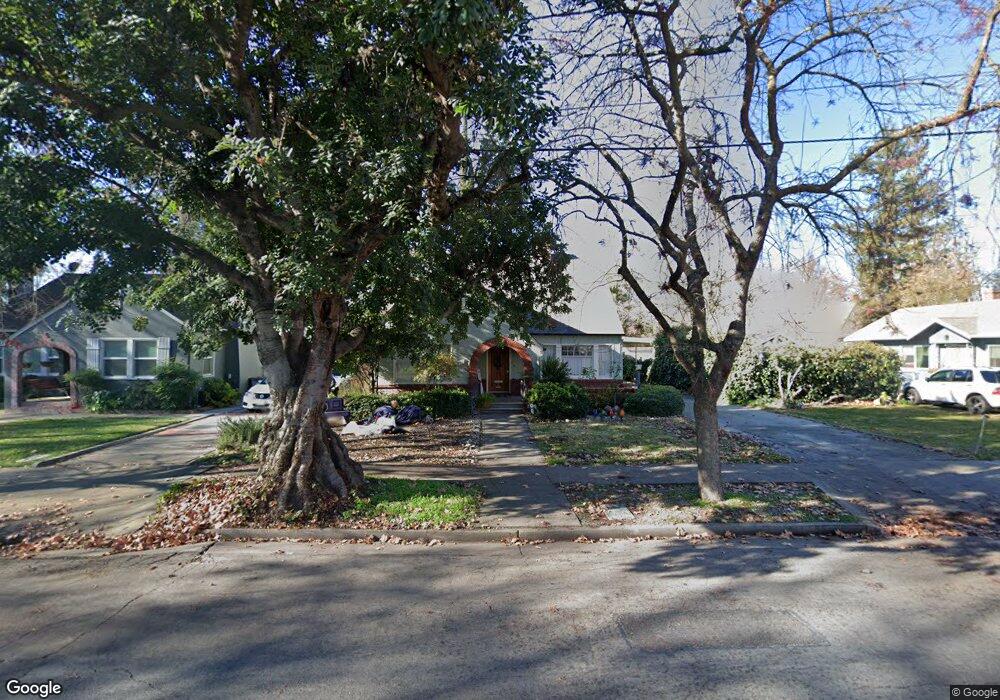
816 3rd St Woodland, CA 95695
Estimated Value: $599,000 - $856,000
4
Beds
2
Baths
2,493
Sq Ft
$273/Sq Ft
Est. Value
About This Home
This home is located at 816 3rd St, Woodland, CA 95695 and is currently estimated at $680,205, approximately $272 per square foot. 816 3rd St is a home located in Yolo County with nearby schools including Dingle Elementary School, Douglass Middle School, and Pioneer High School.
Ownership History
Date
Name
Owned For
Owner Type
Purchase Details
Closed on
Jun 4, 2019
Sold by
Sandsor John A and Sandsor Lynn M
Bought by
Sandsor John A and Sandsor Lynn M
Current Estimated Value
Purchase Details
Closed on
Dec 8, 2000
Sold by
Cross Ronald W C and Cross Robert C
Bought by
Sandsor John A and Sandsor Lynn M
Home Financials for this Owner
Home Financials are based on the most recent Mortgage that was taken out on this home.
Original Mortgage
$165,000
Outstanding Balance
$60,673
Interest Rate
7.67%
Estimated Equity
$619,532
Purchase Details
Closed on
Oct 16, 2000
Sold by
Cross Jeanette E Tr
Bought by
Cross Ronald W and Cross Robert C
Home Financials for this Owner
Home Financials are based on the most recent Mortgage that was taken out on this home.
Original Mortgage
$165,000
Outstanding Balance
$60,673
Interest Rate
7.67%
Estimated Equity
$619,532
Create a Home Valuation Report for This Property
The Home Valuation Report is an in-depth analysis detailing your home's value as well as a comparison with similar homes in the area
Home Values in the Area
Average Home Value in this Area
Purchase History
| Date | Buyer | Sale Price | Title Company |
|---|---|---|---|
| Sandsor John A | -- | None Available | |
| Sandsor John A | $285,000 | North American Title | |
| Cross Ronald W | -- | -- |
Source: Public Records
Mortgage History
| Date | Status | Borrower | Loan Amount |
|---|---|---|---|
| Open | Sandsor John A | $165,000 |
Source: Public Records
Tax History Compared to Growth
Tax History
| Year | Tax Paid | Tax Assessment Tax Assessment Total Assessment is a certain percentage of the fair market value that is determined by local assessors to be the total taxable value of land and additions on the property. | Land | Improvement |
|---|---|---|---|---|
| 2025 | $4,354 | $429,433 | $128,073 | $301,360 |
| 2023 | $4,354 | $412,758 | $123,100 | $289,658 |
| 2022 | $4,180 | $404,666 | $120,687 | $283,979 |
| 2021 | $4,112 | $396,732 | $118,321 | $278,411 |
| 2020 | $4,053 | $392,665 | $117,108 | $275,557 |
| 2019 | $3,975 | $384,966 | $114,812 | $270,154 |
| 2018 | $3,934 | $377,418 | $112,561 | $264,857 |
| 2017 | $3,847 | $370,018 | $110,354 | $259,664 |
| 2016 | $3,780 | $362,764 | $108,191 | $254,573 |
| 2015 | $3,651 | $357,316 | $106,566 | $250,750 |
| 2014 | $3,651 | $350,318 | $104,479 | $245,839 |
Source: Public Records
Map
Nearby Homes