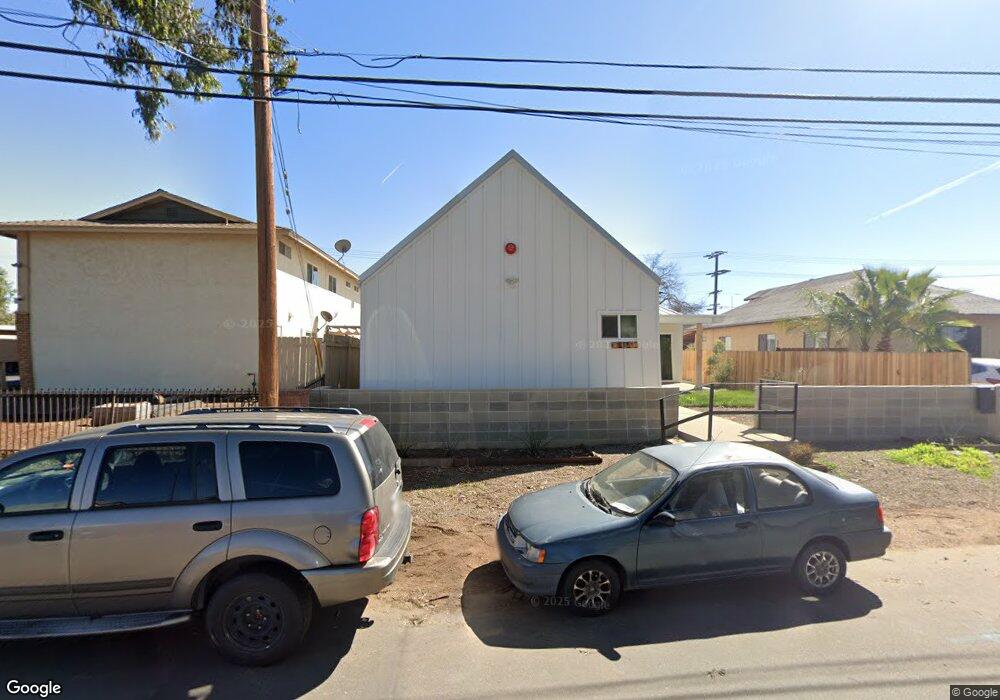
816 B St Ramona, CA 92065
Estimated Value: $848,000 - $2,711,465
21
Beds
10
Baths
4,188
Sq Ft
$429/Sq Ft
Est. Value
About This Home
This home is located at 816 B St, Ramona, CA 92065 and is currently estimated at $1,795,616, approximately $428 per square foot. 816 B St is a home located in San Diego County with nearby schools including Ramona Elementary School, Olive Peirce Middle School, and Ramona High School.
Ownership History
Date
Name
Owned For
Owner Type
Purchase Details
Closed on
Mar 25, 2020
Sold by
Hsu Anthony Yu Cheng
Bought by
Shubh Estates Llc
Current Estimated Value
Home Financials for this Owner
Home Financials are based on the most recent Mortgage that was taken out on this home.
Original Mortgage
$86,250
Outstanding Balance
$76,075
Interest Rate
3.4%
Mortgage Type
New Conventional
Estimated Equity
$1,719,541
Purchase Details
Closed on
Jul 26, 2019
Sold by
Hsu Anthony Yu Cheng
Bought by
Shubh Estates Llc
Home Financials for this Owner
Home Financials are based on the most recent Mortgage that was taken out on this home.
Original Mortgage
$86,250
Interest Rate
3.4%
Mortgage Type
New Conventional
Create a Home Valuation Report for This Property
The Home Valuation Report is an in-depth analysis detailing your home's value as well as a comparison with similar homes in the area
Home Values in the Area
Average Home Value in this Area
Purchase History
| Date | Buyer | Sale Price | Title Company |
|---|---|---|---|
| Shubh Estates Llc | $1,900,000 | California Title Co | |
| Larson David | $115,000 | Fidelity National Title | |
| Larson David | -- | Fidelity National Title | |
| Shubh Estates Llc | $1,900,000 | California Title Co | |
| Larson David | $115,000 | Fidelity National Title | |
| Larson David | -- | Fidelity National Title |
Source: Public Records
Mortgage History
| Date | Status | Borrower | Loan Amount |
|---|---|---|---|
| Open | Larson David | $86,250 | |
| Closed | Larson David | $86,250 | |
| Previous Owner | Larson David | $86,250 |
Source: Public Records
Tax History
| Year | Tax Paid | Tax Assessment Tax Assessment Total Assessment is a certain percentage of the fair market value that is determined by local assessors to be the total taxable value of land and additions on the property. | Land | Improvement |
|---|---|---|---|---|
| 2025 | $9,461 | $795,905 | $125,030 | $670,875 |
| 2024 | $9,478 | $780,300 | $122,579 | $657,721 |
| 2023 | $5,969 | $484,883 | $120,372 | $364,511 |
| 2022 | $2,292 | $118,513 | $108,208 | $10,305 |
| 2021 | $1,485 | $116,190 | $106,087 | $10,103 |
| 2020 | $716 | $43,703 | $42,039 | $1,664 |
| 2019 | $515 | $42,847 | $41,215 | $1,632 |
| 2018 | $503 | $42,007 | $40,407 | $1,600 |
| 2017 | $494 | $41,184 | $39,615 | $1,569 |
| 2016 | $484 | $40,378 | $38,839 | $1,539 |
| 2015 | $478 | $39,772 | $38,256 | $1,516 |
| 2014 | $468 | $38,994 | $37,507 | $1,487 |
Source: Public Records
Map
Nearby Homes
Your Personal Tour Guide
Ask me questions while you tour the home.