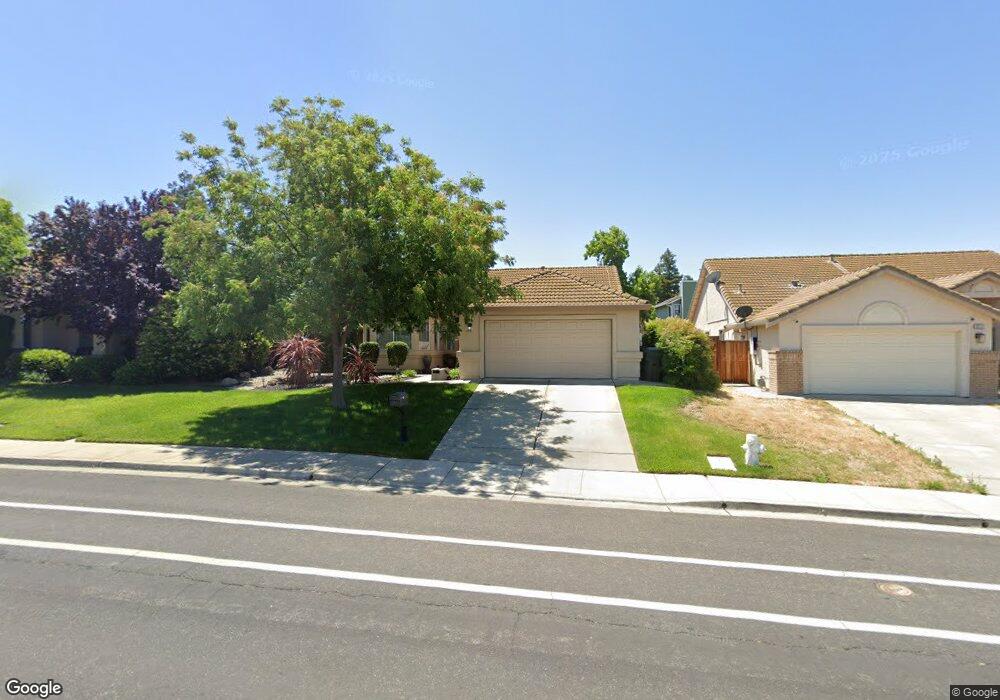
816 Carpinteria Dr Antioch, CA 94509
Deer Valley NeighborhoodEstimated Value: $559,168 - $642,000
3
Beds
2
Baths
1,537
Sq Ft
$391/Sq Ft
Est. Value
About This Home
This home is located at 816 Carpinteria Dr, Antioch, CA 94509 and is currently estimated at $600,292, approximately $390 per square foot. 816 Carpinteria Dr is a home located in Contra Costa County with nearby schools including John Muir Elementary School, Dallas Ranch Middle School, and Deer Valley High School.
Ownership History
Date
Name
Owned For
Owner Type
Purchase Details
Closed on
Dec 28, 2015
Sold by
Dickson Hollie D
Bought by
Vaughn Greg J and Vaughn Sunny R
Current Estimated Value
Home Financials for this Owner
Home Financials are based on the most recent Mortgage that was taken out on this home.
Original Mortgage
$321,530
Outstanding Balance
$255,552
Interest Rate
3.94%
Mortgage Type
FHA
Estimated Equity
$344,740
Purchase Details
Closed on
Apr 22, 2002
Sold by
Seifer Irl H and Seifer Laraine
Bought by
Dickson Hollie D
Home Financials for this Owner
Home Financials are based on the most recent Mortgage that was taken out on this home.
Original Mortgage
$243,750
Interest Rate
7.08%
Mortgage Type
Stand Alone First
Purchase Details
Closed on
Aug 29, 2000
Sold by
Hofmann Construction Co
Bought by
Seifer Iri H and Seifer Laraine
Home Financials for this Owner
Home Financials are based on the most recent Mortgage that was taken out on this home.
Original Mortgage
$178,600
Interest Rate
8.05%
Mortgage Type
Purchase Money Mortgage
Create a Home Valuation Report for This Property
The Home Valuation Report is an in-depth analysis detailing your home's value as well as a comparison with similar homes in the area
Home Values in the Area
Average Home Value in this Area
Purchase History
| Date | Buyer | Sale Price | Title Company |
|---|---|---|---|
| Vaughn Greg J | $344,000 | First American Title Company | |
| Dickson Hollie D | $285,000 | Placer Title Company | |
| Seifer Iri H | $223,500 | First American Title Guarant |
Source: Public Records
Mortgage History
| Date | Status | Borrower | Loan Amount |
|---|---|---|---|
| Open | Vaughn Greg J | $321,530 | |
| Previous Owner | Dickson Hollie D | $243,750 | |
| Previous Owner | Seifer Iri H | $178,600 |
Source: Public Records
Tax History
| Year | Tax Paid | Tax Assessment Tax Assessment Total Assessment is a certain percentage of the fair market value that is determined by local assessors to be the total taxable value of land and additions on the property. | Land | Improvement |
|---|---|---|---|---|
| 2025 | $4,886 | $407,218 | $82,861 | $324,357 |
| 2024 | $4,595 | $399,235 | $81,237 | $317,998 |
| 2023 | $4,595 | $391,408 | $79,645 | $311,763 |
| 2022 | $4,525 | $383,734 | $78,084 | $305,650 |
| 2021 | $4,389 | $376,210 | $76,553 | $299,657 |
| 2019 | $4,287 | $365,054 | $74,284 | $290,770 |
| 2018 | $4,126 | $357,897 | $72,828 | $285,069 |
| 2017 | $4,039 | $350,880 | $71,400 | $279,480 |
| 2016 | $3,940 | $344,000 | $70,000 | $274,000 |
| 2015 | $3,592 | $281,000 | $108,454 | $172,546 |
| 2014 | $4,286 | $277,000 | $106,911 | $170,089 |
Source: Public Records
Map
Nearby Homes
- 924 Flintrock Dr
- 1009 Flintrock Dr
- 3419 Barmouth Dr
- 941 Bluerock Dr
- 3937 Pebble Dr
- 224 Cobblestone Dr
- 4100 Diorite Ct
- 3218 Westbourne Dr
- 318 Redrock Dr
- 3405 Garrow Dr
- 425 Sandy Hill Ct
- 2600 Covelite Way
- 3017 Windsor Dr
- 2794 Lily Ct
- 108 Fleetwood Dr
- 33 Selena Ct
- 3020 Windsor Dr
- 3508 Alberti Ct
- 3504 Alberti Ct
- 4729 Matterhorn Ct
- 820 Carpinteria Dr
- 812 Carpinteria Dr
- 3916 Rockford Dr
- 3912 Rockford Dr
- 824 Carpinteria Dr
- 3920 Rockford Dr
- 808 Carpinteria Dr
- 3908 Rockford Dr
- 3924 Rockford Dr
- 828 Carpinteria Dr
- 804 Carpinteria Dr
- 3904 Rockford Dr
- 832 Carpinteria Dr
- 3928 Rockford Dr
- 800 Carpinteria Dr
- 3917 Rockford Dr
- 3901 Rocky Point Dr
- 3913 Rockford Dr
- 3932 Rockford Dr
- 721 Topaz Ct
Your Personal Tour Guide
Ask me questions while you tour the home.