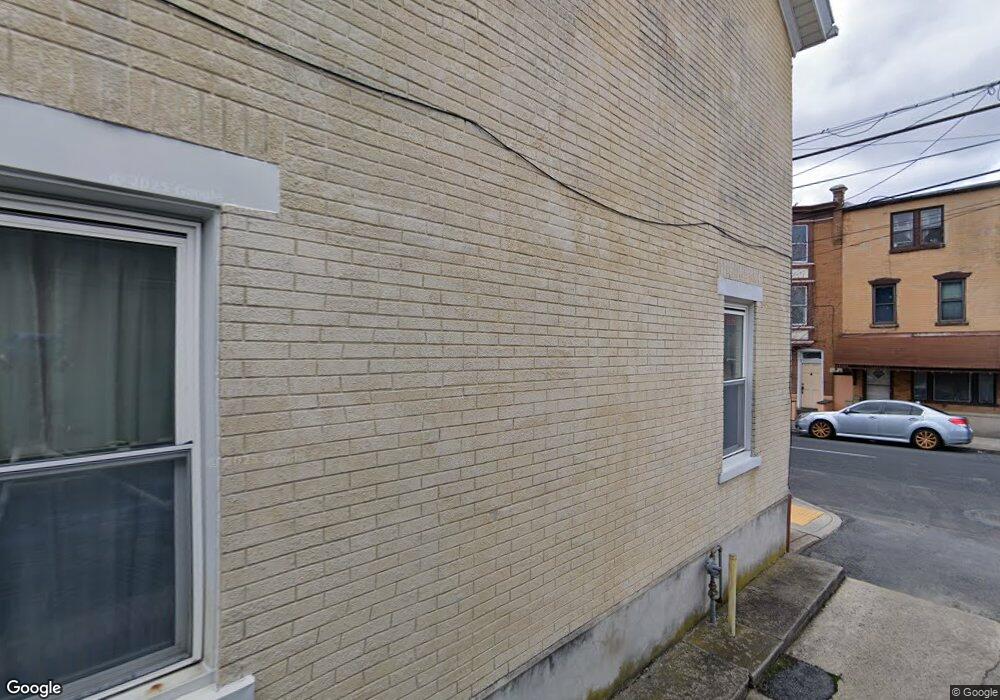
816 Chew St Unit 820 Allentown, PA 18102
Center City NeighborhoodEstimated Value: $284,000 - $331,000
3
Beds
2
Baths
1,144
Sq Ft
$266/Sq Ft
Est. Value
About This Home
This home is located at 816 Chew St Unit 820, Allentown, PA 18102 and is currently estimated at $303,829, approximately $265 per square foot. 816 Chew St Unit 820 is a home located in Lehigh County with nearby schools including Central Elementary School, Francis D Raub Middle School, and William Allen High School.
Ownership History
Date
Name
Owned For
Owner Type
Purchase Details
Closed on
Jan 9, 2018
Sold by
Grossman Kenneth and Grossman Jason
Bought by
Grossman Jason S
Current Estimated Value
Home Financials for this Owner
Home Financials are based on the most recent Mortgage that was taken out on this home.
Original Mortgage
$130,000
Outstanding Balance
$109,677
Interest Rate
3.93%
Mortgage Type
New Conventional
Estimated Equity
$194,152
Purchase Details
Closed on
Mar 26, 2004
Sold by
Bednarik Mary L and Bednarik Mary
Bought by
Grossman Kenneth
Home Financials for this Owner
Home Financials are based on the most recent Mortgage that was taken out on this home.
Original Mortgage
$94,400
Interest Rate
5.56%
Mortgage Type
Purchase Money Mortgage
Purchase Details
Closed on
Jun 21, 1993
Sold by
Bednarik John P and Bednarik Mary
Bought by
Bednarik Mary L
Create a Home Valuation Report for This Property
The Home Valuation Report is an in-depth analysis detailing your home's value as well as a comparison with similar homes in the area
Home Values in the Area
Average Home Value in this Area
Purchase History
| Date | Buyer | Sale Price | Title Company |
|---|---|---|---|
| Grossman Jason S | -- | None Available | |
| Grossman Kenneth | $118,000 | -- | |
| Bednarik Mary L | -- | -- |
Source: Public Records
Mortgage History
| Date | Status | Borrower | Loan Amount |
|---|---|---|---|
| Open | Grossman Jason S | $130,000 | |
| Closed | Grossman Kenneth | $94,400 |
Source: Public Records
Tax History Compared to Growth
Tax History
| Year | Tax Paid | Tax Assessment Tax Assessment Total Assessment is a certain percentage of the fair market value that is determined by local assessors to be the total taxable value of land and additions on the property. | Land | Improvement |
|---|---|---|---|---|
| 2025 | $4,346 | $125,300 | $25,000 | $100,300 |
| 2024 | $4,346 | $125,300 | $25,000 | $100,300 |
| 2023 | $4,346 | $125,300 | $25,000 | $100,300 |
| 2022 | $4,203 | $125,300 | $100,300 | $25,000 |
| 2021 | $4,125 | $125,300 | $25,000 | $100,300 |
| 2020 | $4,024 | $125,300 | $25,000 | $100,300 |
| 2019 | $3,963 | $125,300 | $25,000 | $100,300 |
| 2018 | $3,661 | $125,300 | $25,000 | $100,300 |
| 2017 | $3,573 | $125,300 | $25,000 | $100,300 |
| 2016 | $461 | $125,300 | $25,000 | $100,300 |
| 2015 | -- | $125,300 | $25,000 | $100,300 |
| 2014 | -- | $125,300 | $25,000 | $100,300 |
Source: Public Records
Map
Nearby Homes
- 828 W Gordon St
- 101 N 8th St
- 417 Fulton St
- 319 N Church St
- 938 W Gordon St
- 436 N Hall St
- 247 N 10th St
- 730 W Liberty St
- 737 W Liberty St
- 443 N 7th St
- 515 N Lumber St Unit 3
- 516 N Lumber St
- 1018 Zieglers Ct
- 405 N 6th St
- 528 N Refwal St
- 521 W Turner St
- 508 Park St
- 526 W Gordon St Unit 1
- 518 Oak St
- 816 W Allen St
- 818 W Chew St
- 814 W Chew St
- 820 W Chew St
- 816 W Chew St
- 250 N 8th St
- 240 N Refwal St
- 822 W Chew St
- 824 W Chew St
- 238 N Refwal St
- 248 N 8th St
- 815 W Chew St
- 813 Chew St Unit 819
- 240 N 8th St
- 821 Chew St Unit 827
- 246 N 8th St
- 246 N 8th St Unit Rear
- 244 N 8th St Unit 1
- 244 N 8th St
- 817 W Chew St
- 813 W Chew St