Estimated Value: $57,000 - $111,000
3
Beds
2
Baths
2,160
Sq Ft
$43/Sq Ft
Est. Value
About This Home
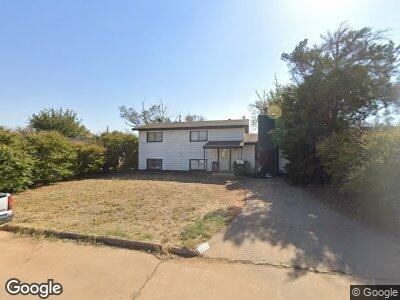
This home is located at 816 Denise St, Altus, OK 73521 and is currently estimated at $93,408, approximately $43 per square foot. 816 Denise St is a home located in Jackson County with nearby schools including Altus High School and Altus Christian Academy.
Ownership History
Date
Name
Owned For
Owner Type
Purchase Details
Closed on
May 20, 2015
Sold by
Welch Robert and Welch Rebecca
Bought by
Coe Michelle
Current Estimated Value
Purchase Details
Closed on
Aug 7, 2013
Sold by
Huffer Roberta
Bought by
Welch Robert and Welch Rebecca
Purchase Details
Closed on
May 30, 2013
Sold by
Haga Richard and Haga Dora
Bought by
Huffer Roberta
Purchase Details
Closed on
Sep 19, 2008
Sold by
Huffer Roberta
Bought by
Haga Richard and Haga Dora
Purchase Details
Closed on
Aug 14, 2007
Sold by
Buriss Mary Jo and Thorston Mary Jo
Bought by
Barnhart Brenda C and Thornton John W
Create a Home Valuation Report for This Property
The Home Valuation Report is an in-depth analysis detailing your home's value as well as a comparison with similar homes in the area
Home Values in the Area
Average Home Value in this Area
Purchase History
| Date | Buyer | Sale Price | Title Company |
|---|---|---|---|
| Coe Michelle | -- | None Available | |
| Welch Robert | $31,000 | None Available | |
| Huffer Roberta | -- | None Available | |
| Haga Richard | $64,375 | None Available | |
| Barnhart Brenda C | -- | None Available |
Source: Public Records
Tax History Compared to Growth
Tax History
| Year | Tax Paid | Tax Assessment Tax Assessment Total Assessment is a certain percentage of the fair market value that is determined by local assessors to be the total taxable value of land and additions on the property. | Land | Improvement |
|---|---|---|---|---|
| 2024 | $527 | $6,377 | $1,131 | $5,246 |
| 2023 | $527 | $5,784 | $1,131 | $4,653 |
| 2022 | $467 | $5,509 | $1,131 | $4,378 |
| 2021 | $448 | $5,247 | $1,131 | $4,116 |
| 2020 | $432 | $4,997 | $1,131 | $3,866 |
| 2019 | $444 | $5,089 | $1,131 | $3,958 |
| 2018 | $368 | $4,923 | $1,131 | $3,792 |
| 2017 | $380 | $5,089 | $1,131 | $3,958 |
| 2016 | $380 | $5,094 | $1,131 | $3,963 |
| 2015 | $406 | $5,442 | $1,020 | $4,422 |
| 2014 | $401 | $5,369 | $1,020 | $4,349 |
Source: Public Records
Map
Nearby Homes