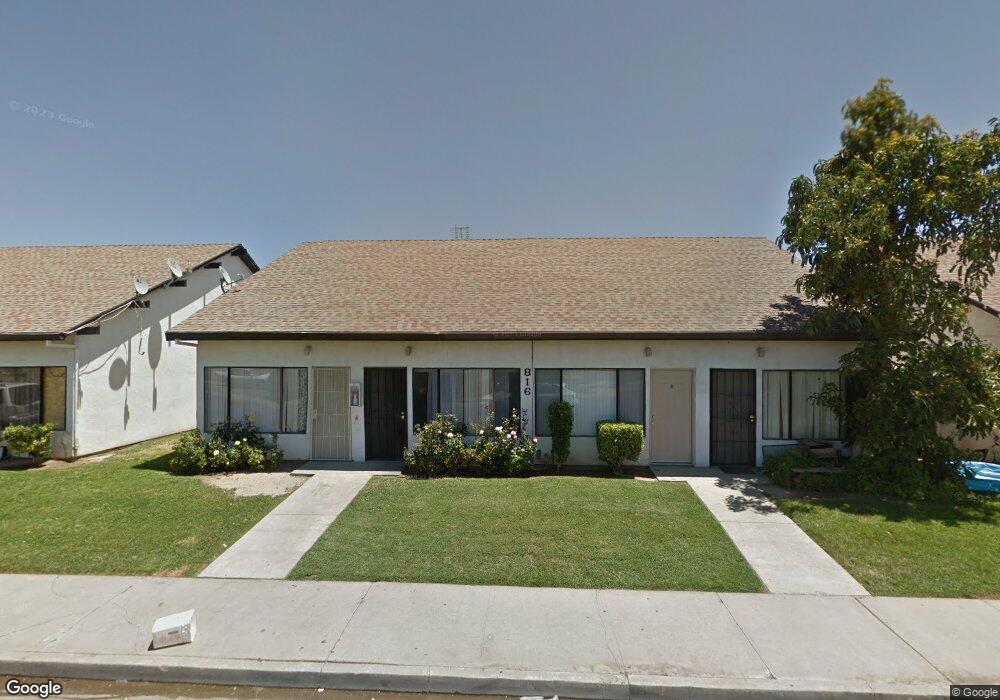
816 Illinois Ave Unit 9 Los Banos, CA 93635
Estimated Value: $181,000 - $220,000
2
Beds
1
Bath
744
Sq Ft
$274/Sq Ft
Est. Value
About This Home
This home is located at 816 Illinois Ave Unit 9, Los Banos, CA 93635 and is currently estimated at $204,132, approximately $274 per square foot. 816 Illinois Ave Unit 9 is a home located in Merced County with nearby schools including Henry Miller Elementary School, Creekside Junior High School, and Los Banos High School.
Ownership History
Date
Name
Owned For
Owner Type
Purchase Details
Closed on
Jul 19, 2012
Sold by
Howard Albert
Bought by
Howard Vera
Current Estimated Value
Purchase Details
Closed on
Feb 24, 2009
Sold by
Kwatra Deepak
Bought by
Kwatra Seema
Purchase Details
Closed on
Oct 17, 2008
Sold by
Mihos Vassilios and Mihos Eleni
Bought by
Hsbc Bank Usa National Association
Purchase Details
Closed on
Dec 5, 2005
Sold by
Shrager Leon and Shrager Nancy
Bought by
Mihos Vassilios and Mihos Eleni
Home Financials for this Owner
Home Financials are based on the most recent Mortgage that was taken out on this home.
Original Mortgage
$135,000
Interest Rate
9.6%
Mortgage Type
Purchase Money Mortgage
Purchase Details
Closed on
Jul 17, 2004
Sold by
Shrager Leon and Shrager Nancy
Bought by
The Shrager Family Trust
Create a Home Valuation Report for This Property
The Home Valuation Report is an in-depth analysis detailing your home's value as well as a comparison with similar homes in the area
Home Values in the Area
Average Home Value in this Area
Purchase History
| Date | Buyer | Sale Price | Title Company |
|---|---|---|---|
| Howard Vera | -- | Transcounty Title Company | |
| Howard Vera | $32,000 | Transcounty Title Company | |
| Kwatra Seema | -- | First American Title Company | |
| Kwatra Seema | $22,500 | First American Title Company | |
| Hsbc Bank Usa National Association | $54,000 | First American Title Company | |
| Mihos Vassilios | $150,000 | Chicago Title Company | |
| The Shrager Family Trust | -- | -- |
Source: Public Records
Mortgage History
| Date | Status | Borrower | Loan Amount |
|---|---|---|---|
| Previous Owner | Mihos Vassilios | $135,000 |
Source: Public Records
Tax History Compared to Growth
Tax History
| Year | Tax Paid | Tax Assessment Tax Assessment Total Assessment is a certain percentage of the fair market value that is determined by local assessors to be the total taxable value of land and additions on the property. | Land | Improvement |
|---|---|---|---|---|
| 2025 | $446 | $39,265 | $11,074 | $28,191 |
| 2024 | $446 | $38,496 | $10,857 | $27,639 |
| 2023 | $422 | $37,743 | $10,645 | $27,098 |
| 2022 | $415 | $37,004 | $10,437 | $26,567 |
| 2021 | $411 | $36,280 | $10,233 | $26,047 |
| 2020 | $405 | $35,909 | $10,129 | $25,780 |
| 2019 | $398 | $35,206 | $9,931 | $25,275 |
| 2018 | $385 | $34,517 | $9,737 | $24,780 |
| 2017 | $380 | $33,842 | $9,547 | $24,295 |
| 2016 | $385 | $33,179 | $9,360 | $23,819 |
| 2015 | $377 | $32,682 | $9,220 | $23,462 |
| 2014 | $367 | $32,043 | $9,040 | $23,003 |
Source: Public Records
Map
Nearby Homes
- 0 Illinois Ave Unit 225094934
- 233 W I St
- 133 W I St
- 0 W I St Unit ML81999689
- 2120 Coulter Ln
- 1102 California Ave
- 1016 Maryland Ave
- 1130 Delaware Ave
- 1117 Iowa Ave
- 339 H St
- 1227 California Ave
- 860 Fritz Dr
- 1022 4th St
- 925 W J St
- 411 J St
- 422 J St
- 737 Betten St
- 625 Betten St
- 601 Betten St
- 127 Willmott Ave
- 816 Illinois Ave
- 816 Illinois Ave Unit 12
- 816 Illinois Ave Unit 11
- 816 Illinois Ave Unit 10
- 812 Illinois Ave
- 812 Illinois Ave Unit 8
- 812 Illinois Ave Unit 7
- 812 Illinois Ave Unit 6
- 812 Illinois Ave Unit 5
- 820 Illinois Ave
- 820 Illinois Ave Unit 16
- 820 Illinois Ave Unit 15
- 820 Illinois Ave Unit 14
- 820 Illinois Ave Unit 13
- 803 Arizona Ave
- 824 Illinois Ave
- 824 Illinois Ave Unit 20
- 824 Illinois Ave Unit 19
- 824 Illinois Ave Unit 18
- 824 Illinois Ave Unit 17