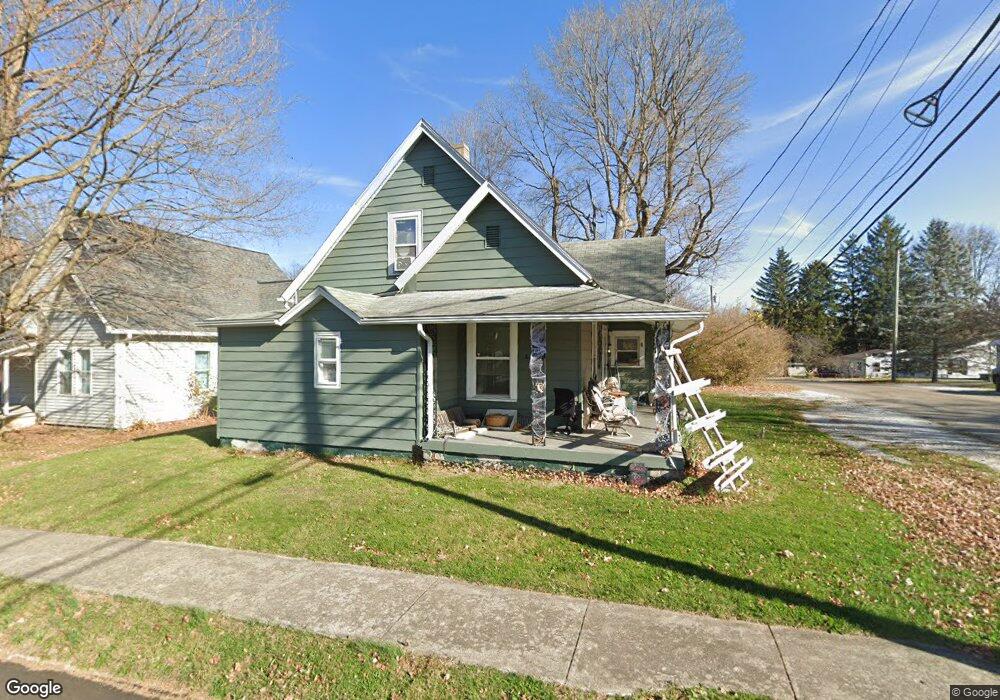
816 John St Crawfordsville, IN 47933
Estimated Value: $137,000 - $166,880
3
Beds
1
Bath
1,764
Sq Ft
$85/Sq Ft
Est. Value
About This Home
This home is located at 816 John St, Crawfordsville, IN 47933 and is currently estimated at $150,220, approximately $85 per square foot. 816 John St is a home located in Montgomery County with nearby schools including Mollie B. Hoover Elementary School, Laura Hose Elementary School, and Meredith Nicholson Elementary School.
Ownership History
Date
Name
Owned For
Owner Type
Purchase Details
Closed on
Apr 29, 2015
Sold by
Gupta Vinod C
Bought by
Alsman Melissa
Current Estimated Value
Purchase Details
Closed on
Jul 9, 2014
Sold by
Philpott Mary C and Mary C Philpott Revocable Trus
Bought by
Alsman Melissa
Home Financials for this Owner
Home Financials are based on the most recent Mortgage that was taken out on this home.
Original Mortgage
$25,000
Interest Rate
4.19%
Mortgage Type
Seller Take Back
Purchase Details
Closed on
Jun 19, 2014
Sold by
Knk Group Llc
Bought by
Philpott Mary C and Mary C Philpott Revocable Trus
Home Financials for this Owner
Home Financials are based on the most recent Mortgage that was taken out on this home.
Original Mortgage
$25,000
Interest Rate
4.19%
Mortgage Type
Seller Take Back
Purchase Details
Closed on
Jun 18, 2013
Sold by
Gooding Dennis D and Gooding Beth A
Bought by
Knk Group Llc
Create a Home Valuation Report for This Property
The Home Valuation Report is an in-depth analysis detailing your home's value as well as a comparison with similar homes in the area
Home Values in the Area
Average Home Value in this Area
Purchase History
| Date | Buyer | Sale Price | Title Company |
|---|---|---|---|
| Alsman Melissa | -- | None Available | |
| Alsman Melissa | -- | Partners Title Group Inc | |
| Philpott Mary C | -- | Partners Title Group Inc | |
| Knk Group Llc | -- | None Available |
Source: Public Records
Mortgage History
| Date | Status | Borrower | Loan Amount |
|---|---|---|---|
| Previous Owner | Alsman Melissa | $25,000 |
Source: Public Records
Tax History Compared to Growth
Tax History
| Year | Tax Paid | Tax Assessment Tax Assessment Total Assessment is a certain percentage of the fair market value that is determined by local assessors to be the total taxable value of land and additions on the property. | Land | Improvement |
|---|---|---|---|---|
| 2024 | $767 | $90,100 | $14,200 | $75,900 |
| 2023 | $627 | $81,200 | $11,400 | $69,800 |
| 2022 | $567 | $75,500 | $11,400 | $64,100 |
| 2021 | $522 | $67,300 | $11,400 | $55,900 |
| 2020 | $513 | $71,800 | $11,400 | $60,400 |
| 2019 | $495 | $69,600 | $11,400 | $58,200 |
| 2018 | $434 | $68,500 | $8,500 | $60,000 |
| 2017 | $432 | $65,800 | $8,500 | $57,300 |
| 2016 | $240 | $62,800 | $8,500 | $54,300 |
| 2014 | $125 | $44,700 | $8,500 | $36,200 |
| 2013 | $125 | $57,300 | $8,500 | $48,800 |
Source: Public Records
Map
Nearby Homes
- 805 Prospect St
- 706.5 John St
- 1107 Danville Ave
- 801 Tuttle Ave
- 1121 Mill St
- 902 Vandalia St
- 409 E Jefferson St
- 00 E State Road 32
- 00 E Co Rd 350 Rd S
- 00 N Nucor Rd
- 703 S Green St
- 206 E Franklin St
- 1419 Danville Ave
- 615 S Green St
- 413 S Water St
- 103 E Chestnut St
- 415 E Wabash Ave
- 114 Central Ave
- 313 E Wabash Ave
- 408 E Wabash Ave